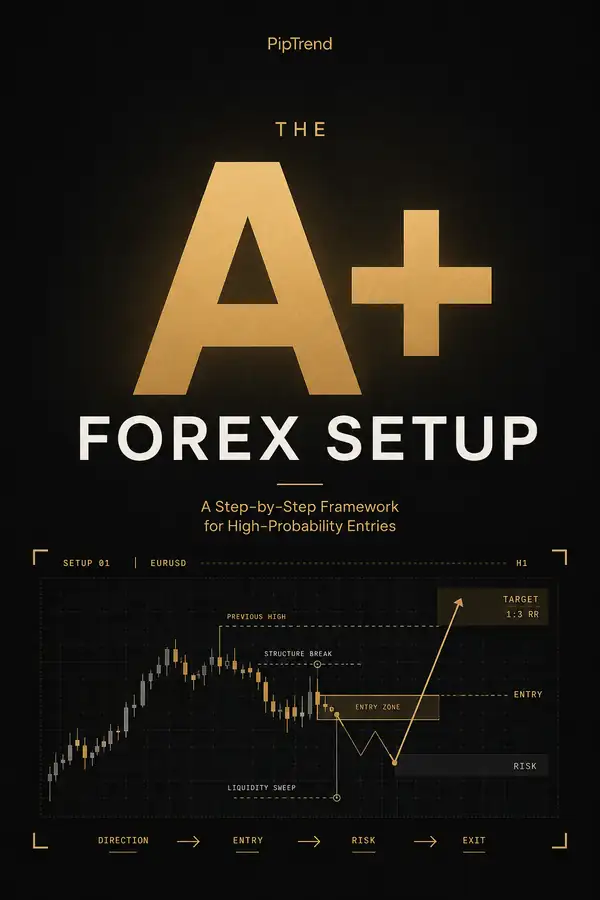
Eurusd Chart Guide: Navigate Forex Trends in 2026
On this page
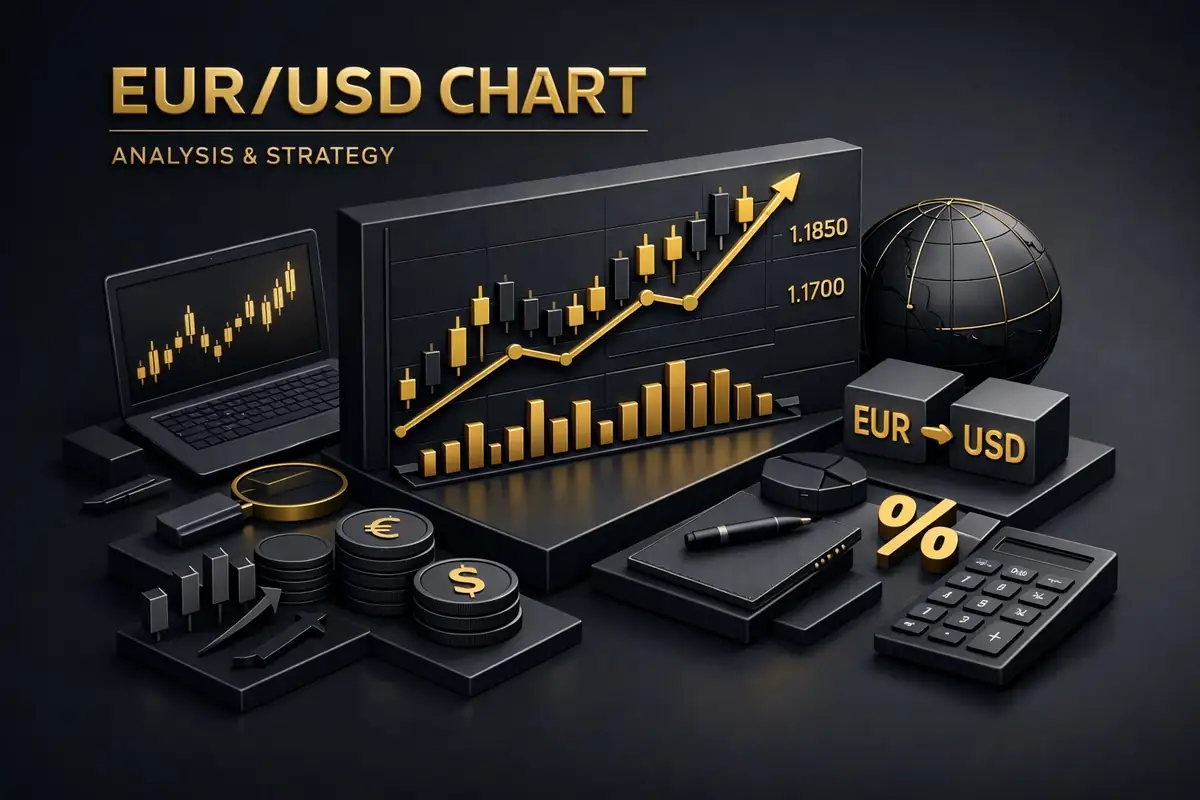
In 2026, rapidly shifting global economies and increased market volatility make understanding the eurusd chart more critical than ever for forex traders. Staying ahead of these changes can unlock new profit opportunities and help you avoid unnecessary risks. By mastering eurusd chart analysis, you gain the tools needed to interpret price action, anticipate key market moves, and respond with confidence.
This guide delivers actionable insights, proven techniques, and future-focused strategies tailored for the challenges of 2026. Dive in to discover essential charting methods, how to spot major trends, and the best practices for navigating the EUR/USD landscape with clarity.
Understanding the EUR/USD Pair in 2026
The EUR/USD pair dominates forex trading worldwide, acting as a barometer for global economic health. For anyone analyzing a eurusd chart, this pair’s liquidity and volatility offer both opportunity and complexity. As we move into 2026, understanding its nuances is essential for traders looking to stay ahead.

Overview of EUR/USD: The World’s Most Traded Currency Pair
The EUR/USD pair represents the exchange rate between the euro and the US dollar. This pairing is the cornerstone of the forex market, accounting for more than 20% of daily trading volume globally. Its deep liquidity ensures tight spreads and reliable price action, making it the most analyzed eurusd chart by both institutional and retail traders.
Historically, the relationship between the euro and the dollar has mirrored shifts in economic power, monetary policy, and geopolitical stability. Major events like Brexit and the COVID-19 pandemic have left visible marks on the eurusd chart, causing sharp moves and prolonged trends. For example, the uncertainty following Brexit triggered a period of heightened volatility, while the pandemic’s onset led to a significant flight to the US dollar as a safe haven.
Looking ahead to 2026, several factors are shaping the market context. Slower but steady economic growth is expected in both the EU and US, accompanied by persistent inflation concerns. According to major forex brokers, average daily trading volumes for EUR/USD remain robust, hovering near $1.2 trillion, while volatility has increased due to ongoing global tensions and monetary policy shifts.
Central banks play a pivotal role in driving the eurusd chart. The European Central Bank (ECB) and the US Federal Reserve continue to influence the pair through interest rate adjustments and policy statements. In 2026, both institutions are expected to maintain a cautious outlook, balancing inflation control with growth support.
EUR/USD often moves in tandem with or against other major pairs such as GBP/USD and USD/JPY, and it is sensitive to commodities like gold and oil. For instance, a surge in gold prices can sometimes signal a weaker US dollar, impacting the eurusd chart. These correlations provide additional layers of insight for traders.
Key Drivers of EUR/USD Trends in 2026
To navigate the eurusd chart in 2026, traders must monitor a range of macroeconomic indicators. Inflation rates, GDP growth, and interest rate differentials between the US and EU are primary drivers. The ECB and Fed’s interest rate decisions will likely remain central, with market participants closely watching for signals of policy tightening or easing.
Political developments are also critical. Elections in the US and leadership changes in key EU states could sway market sentiment and cause sudden shifts on the eurusd chart. The regulatory landscape, especially around digital currencies and cross-border payments, is another emerging factor.
Reputable financial institutions have released forecasts for EUR/USD in 2026. For instance, Deutsche Bank’s 2026 EUR/USD Forecast anticipates moderate appreciation, driven by expected policy divergence and global capital flows. These insights help traders align their eurusd chart strategies with broader market expectations.
Market reactions to economic releases are immediate and pronounced. For example, a higher-than-expected US inflation print can trigger a sharp selloff in the euro, visible as a steep drop on the eurusd chart. Similarly, dovish comments from the ECB can support euro rallies.
In summary, mastering the eurusd chart in 2026 requires a holistic view. By combining historical perspective, real-time data, and an understanding of policy and macro trends, traders can position themselves to capitalize on the world’s most traded currency pair.
Essential EUR/USD Chart Types and Tools
Navigating the eurusd chart in 2026 requires a strong grasp of chart types and technical tools. With global forex volatility on the rise, using the right analytical approach can dramatically impact your trading results. Let’s break down the essential chart types, technical indicators, and platforms that every EUR/USD trader should master.

Candlestick, Line, and Bar Charts: What to Use and When
Understanding which eurusd chart type to use can transform your analysis. Each chart type offers unique benefits, making them suitable for different trading objectives.
| Chart Type | Visual Style | Best For | Key Insights |
|---|---|---|---|
| Candlestick | Colored bars | Spotting patterns/trends | Open, close, high, low |
| Line | Single line | Quick trend overview | Closing prices |
| Bar | Thin bars | Detailed price movement | Open, close, high, low |
Candlestick charts are favored for the eurusd chart as they reveal price action and sentiment shifts. Line charts provide a clean look, ideal for beginners or when you want to focus on overall direction. Bar charts offer a detailed view, useful for identifying subtle changes in volatility.
Recent EUR/USD moves, like the early 2025 breakout, were best visualized on candlestick charts, where bullish engulfing patterns signaled trend reversals. According to industry data, over 60% of forex traders prefer candlestick charts for their clarity and actionable signals. Choose the chart type that aligns with your strategy and trading timeframe.
Technical Analysis Tools for EUR/USD
Selecting the right tools is crucial for extracting actionable signals from any eurusd chart. Major indicators include:
- Moving Averages (SMA, EMA): Identify trend direction and smooth price action.
- RSI, MACD, Stochastic: Detect overbought or oversold conditions.
- Fibonacci Retracement: Map likely support and resistance.
- Bollinger Bands: Gauge volatility and breakout potential.
For example, in 2025, combining a 50-period SMA with RSI on the eurusd chart successfully predicted a reversal as price crossed above the moving average and RSI exited oversold territory. Multi-timeframe analysis, using indicators on daily and 4H charts, improves reliability of signals.
To deepen your understanding of these indicators and how they apply to the eurusd chart, explore this Technical indicators for EUR/USD resource for comprehensive explanations and real-world examples.
Charting Platforms and Resources
Choosing the right platform is vital for effective eurusd chart analysis. Top options include:
- TradingView: Intuitive interface, social sharing, cloud-based, both free and premium plans.
- MetaTrader 4/5: Advanced charting, expert advisor support, vast broker compatibility.
- cTrader: Robust order management, clean design, customizable indicators.
TradingView leads in popularity among forex traders for its ease of use and advanced features, especially for eurusd chart analysis. MetaTrader remains a staple for those who value algorithmic trading and expert advisors. Evaluate each platform’s features to find the best fit for your trading style and goals.
Step-by-Step Guide: Analyzing the EUR/USD Chart in 2026
Navigating the forex market in 2026 demands a methodical approach to analyzing the eurusd chart. By following a clear, step-by-step process, traders can adapt to evolving market conditions and make more confident decisions. This guide breaks down each phase, offering practical techniques and examples tailored to the unique landscape of the coming year.
Step 1: Set Up Your Chart for 2026 Market Conditions
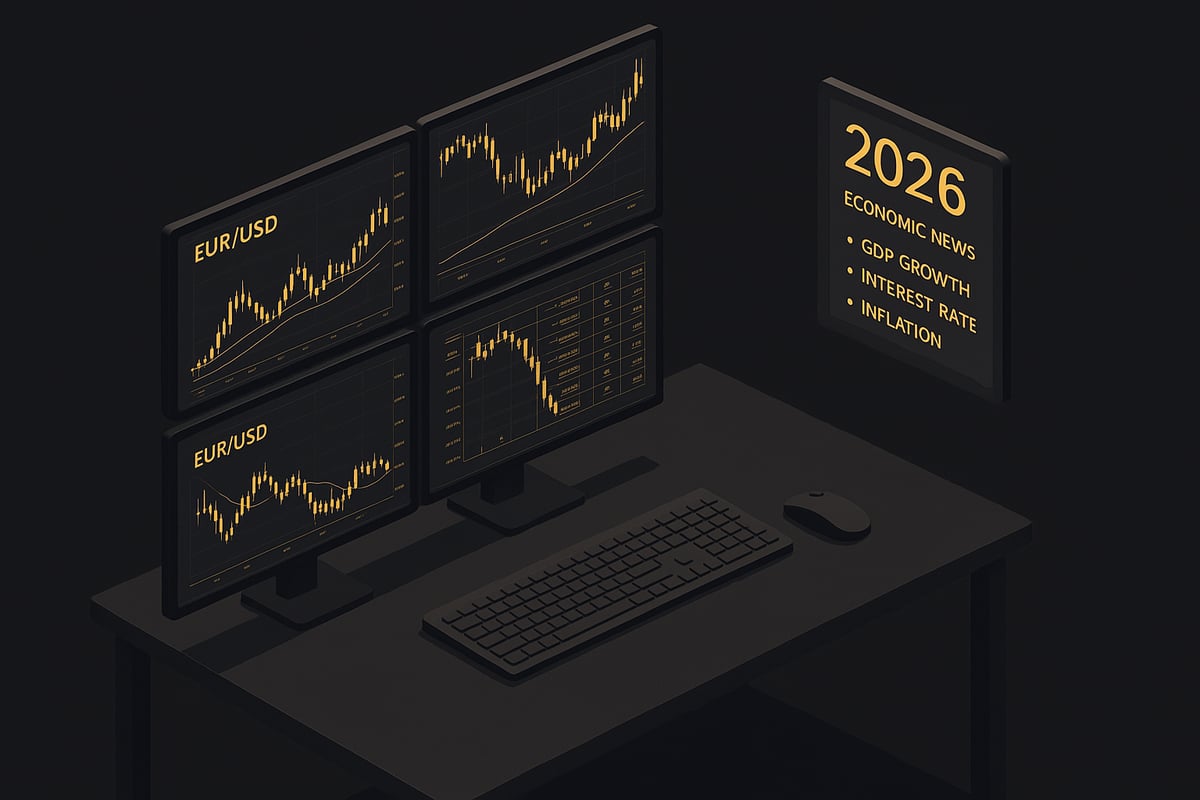
Begin by selecting the appropriate timeframe on your eurusd chart. Intraday traders might focus on 15-minute or hourly intervals, while swing and position traders prefer daily or weekly charts. In 2026, increased volatility may influence your choice of chart interval, so remain flexible.
Next, add indicators suited to current market dynamics. For example, applying a 50-period EMA highlights medium-term trends, while the RSI helps spot overbought or oversold conditions. Consider using a template, as shown below:
# Example TradingView indicator setup
chart.timeframe = "1D"
chart.add_indicator("EMA", period=50)
chart.add_indicator("RSI", period=14)
Choosing the right indicators for your eurusd chart setup can improve clarity and reduce noise, especially in choppy markets. Regularly review your chart templates to ensure alignment with your trading strategy and market conditions.
Step 2: Identify Major Trends and Key Levels
Spotting the primary trend is essential for every eurusd chart analysis. Look for a sequence of higher highs and higher lows to confirm an uptrend, or lower lows and lower highs for a downtrend. Use trendlines and moving averages to visualize these patterns.
Mapping support and resistance zones is also crucial. Horizontal lines drawn at recent swing highs and lows often reveal where price reactions occur. Fibonacci retracement tools can help identify potential reversal points, particularly after sharp moves.
| Tool | Purpose | Example Use |
|---|---|---|
| Trendlines | Visualize trend direction | Uptrend from Jan to Mar |
| Horizontal Levels | Mark support/resistance | 1.0800 as key support |
| Fibonacci Retracement | Spot retracement targets | 38.2% pullback in 2025 |
Revisit these key levels on your eurusd chart regularly, as they often act as magnets for price action, especially during high-impact news releases. Stay alert for breakouts or reversals at these zones.
Step 3: Recognize Chart Patterns and Formations
Identifying classical chart patterns unlocks deeper insight into potential market moves. On your eurusd chart, watch for double tops and bottoms, head and shoulders, triangles, and flags. These formations often precede significant trend reversals or continuations.
For example, a well-defined head and shoulders pattern in late 2025 signaled a notable EUR/USD decline. Recognizing such patterns early allows traders to position themselves ahead of major shifts.
If you want to master these formations, consider referencing a comprehensive Forex chart pattern guide for visual examples and pattern recognition tips. Integrating this knowledge into your chart routine can sharpen your edge in 2026’s dynamic environment.
Step 4: Confirm Signals with Volume and Momentum
Volume and momentum indicators serve as essential confirmation tools on any eurusd chart. Volume spikes often validate breakouts, while declining volume may suggest a false move.
Combine momentum oscillators, such as MACD or stochastic, with volume analysis for higher-probability trades. For instance, a bullish MACD crossover accompanied by rising volume can signal a robust upward move. Monitoring these elements together reduces the risk of acting on unreliable signals.
Be sure to adjust your indicator settings based on market volatility and trading style. Consistent confirmation across multiple indicators increases your confidence in each trade setup.
Step 5: Backtest and Validate Your Analysis
Before risking capital, always backtest your eurusd chart strategies using historical data. This practice helps identify strengths, limitations, and necessary adjustments in your approach.
Use platform tools to simulate trades based on your chosen indicators and patterns. For example, test a moving average crossover strategy on 2024-2025 data to gauge its effectiveness in current market cycles.
Maintain a trading journal to track outcomes and refine your process. Over time, disciplined backtesting fosters greater consistency and resilience, preparing you for the challenges of trading EUR/USD in 2026 and beyond.
Advanced Strategies for Navigating EUR/USD Trends
Navigating the eurusd chart in 2026 requires advanced strategies that blend technical precision with a deep understanding of market drivers. As volatility rises and new technologies emerge, traders must refine their approach to stay ahead of the curve. Below, we explore key advanced techniques to help you master the eurusd chart and adapt to evolving market trends.
Multi-Timeframe Analysis for Greater Accuracy
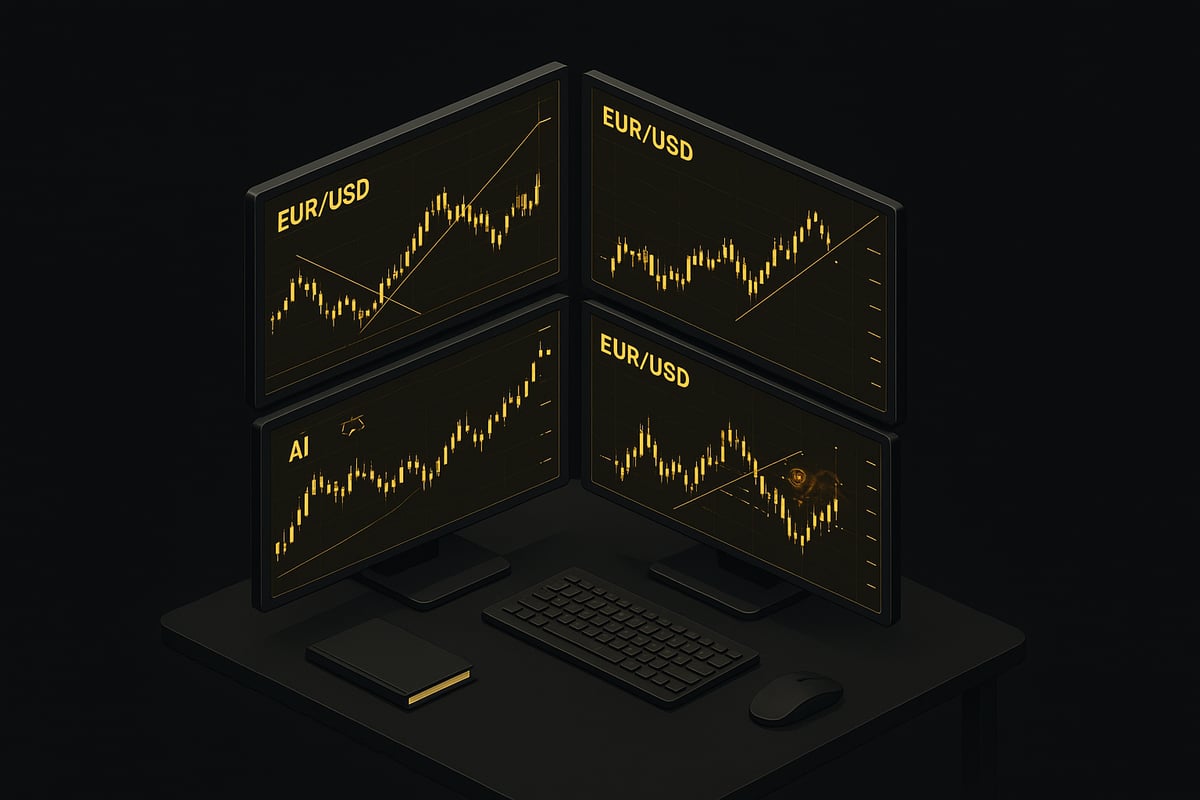
Multi-timeframe analysis offers a comprehensive perspective on the eurusd chart, allowing traders to align signals across daily, 4H, and 1H charts. This approach reduces false signals and provides confirmation before entering trades.
For instance, a swing trader might identify a long-term uptrend on the daily eurusd chart, then look for a pullback and bullish reversal on the 4H or 1H charts for optimal entries. Synchronizing trends across timeframes increases trade confidence and sharpens risk management.
Key steps for effective multi-timeframe analysis:
- Start by identifying the dominant trend on the higher timeframe.
- Use the intermediate timeframe for setup confirmation.
- Fine-tune entries and exits with the lower timeframe.
For an in-depth guide on aligning signals across multiple timeframes, visit Multi-timeframe trading techniques.
Integrating Fundamental and Technical Analysis
Combining fundamental and technical analysis strengthens your decisions on the eurusd chart. Economic calendars and real-time news feeds help you anticipate major moves around central bank announcements, inflation data, or employment reports.
For example, if the ECB signals a policy shift and your technical analysis indicates a breakout on the eurusd chart, the probability of a sustained move increases. Monitoring both economic events and chart formations ensures your strategy adapts to evolving conditions.
To integrate these methods:
- Track upcoming economic releases and assess their potential impact.
- Wait for technical confirmation before acting on news-driven moves.
- Adjust stop-loss and targets based on volatility expectations.
Risk Management and Position Sizing
Robust risk management is essential for long-term success with the eurusd chart. Proper position sizing protects your capital during volatile swings and unexpected reversals.
Begin by calculating your risk per trade, typically 1-2 percent of your account. Use stop-loss orders to cap losses if the eurusd chart moves against your position. Trailing stops can help lock in profits as trends develop.
Consider this case study from 2025: A trader risked only 1 percent per trade during heightened volatility, allowing them to withstand a sudden EUR/USD spike and recover with the next opportunity.
Tips for effective risk management:
- Define your maximum risk per trade and stick to it.
- Adjust position size based on market volatility.
- Regularly review your trade journal for patterns and improvements.
Utilizing Adaptive Trading Indicators for EUR/USD
adaptive indicators are transforming eurusd chart analysis in 2026. These tools process vast data in real time, delivering actionable signals with greater speed and accuracy than manual methods.
AI-driven solutions can detect trend shifts, identify optimal entry points, and filter out market noise. For example, during periods of high volatility, AI indicators provided early alerts on the eurusd chart, outperforming standard moving averages and oscillators.
Benefits of using adaptive indicators include:
- Real-time analysis of multiple timeframes
- Automated detection of support, resistance, and liquidity zones
- Reduced emotional bias in trade decisions
Integrating AI into your eurusd chart strategy helps you react faster to market changes and optimize your risk-reward profile.
Common Pitfalls and Mistakes in EUR/USD Chart Analysis
Understanding the eurusd chart is critical, but even experienced traders fall into common traps. Mistakes often arise from overconfidence, lack of discipline, or simply misreading market signals. A clear grasp of these pitfalls can help you avoid costly errors and refine your trading strategy.
Most Frequent EUR/USD Chart Analysis Mistakes
Even with advanced tools, traders tend to repeat several key mistakes when analyzing the eurusd chart:
- Relying on a single indicator or timeframe: Focusing only on one tool, like RSI or moving averages, can create a misleading picture. Markets are multifaceted, and using a broader set of indicators is essential.
- Ignoring macroeconomic news: Technical setups on the eurusd chart can quickly become invalid if major economic data or central bank decisions are released. Always factor in economic calendars and news events.
- Chasing trades due to FOMO: Entering late after a missed move often leads to poor entries and increased risk. Impulse decisions rarely pay off.
- Misinterpreting chart patterns: Forcing signals or seeing patterns where none exist is a frequent error. Even seasoned traders may misread head and shoulders or double top formations. Consult resources like Investing.com’s EUR/USD Technical Analysis for objective chart assessments.
- Skipping backtesting: Many traders neglect to test their strategies on historical data. Without backtesting, it is hard to know if your approach is truly robust.
Real-World Example: False Breakout Trap
Consider a recent scenario where a eurusd chart showed a potential breakout above resistance. Many traders entered long positions, expecting a sustained rally. However, volume data did not confirm the move, and the price quickly reversed, resulting in losses for those who ignored this confirmation. This highlights why validating signals with multiple indicators, especially volume, is vital.
Trader Statistics, Tips, and How to Avoid Pitfalls
According to leading forex education platforms, over 60% of retail traders make at least one major eurusd chart mistake per month. The most common issue is overtrading based on emotional impulses rather than solid analysis.
To minimize errors, follow these tips:
- Always cross-check trade setups with at least two indicators and multiple timeframes.
- Integrate macroeconomic news with your technical analysis.
- Backtest every strategy before trading live.
- Keep a trading journal to review and learn from past mistakes.
- Explore proven methods, such as those found in EUR/USD trading view strategies, to strengthen your approach.
By developing a disciplined, data-driven routine, you can sidestep the most frequent pitfalls and make smarter decisions using the eurusd chart.
Future Outlook: What’s Next for EUR/USD Charts Beyond 2026?
As we look beyond 2026, the landscape of eurusd chart analysis is poised for major transformation. The interplay of economic forces, evolving technology, and shifting market participation will redefine how traders approach the world’s most traded currency pair.
Expert Forecasts and Scenario Analysis
Financial institutions are already projecting diverse scenarios for the EUR/USD pair as we move past 2026. According to ING’s FX Outlook for 2026, factors such as monetary policy divergence and geopolitical developments are likely to drive significant volatility. Similarly, Convera’s Global FX Outlook December 2025 highlights multiple possible exchange rate paths, emphasizing the need for adaptable eurusd chart strategies.
Key Drivers Shaping Future EUR/USD Trends
Several macroeconomic and political forces will continue to influence the eurusd chart. These include:
- Central bank actions from the ECB and Federal Reserve
- Inflation trends and GDP growth rates
- Political shifts in the US and EU
- Global trade and energy market disruptions
Here is a summary table of potential future drivers:
| Driver | Potential Impact |
|---|---|
| Interest Rate Policy | Trend direction, volatility |
| Geopolitical Events | Sudden price swings |
| AI Adoption in Trading | Faster analysis, efficiency |
| Retail Participation | Increased market influence |
Technology and the Evolving Trading Landscape
Advancements in AI and machine learning are revolutionizing eurusd chart interpretation. Smart algorithms, real-time analytics, and automated trading systems are becoming standard tools for both institutional and retail traders. The rise of algorithmic trading means decisions are made faster, and patterns are detected more accurately than ever.
Retail traders, empowered by social trading platforms and mobile apps, now play a more prominent role in shaping eurusd chart dynamics. As more traders adopt adaptive indicators, the traditional boundaries between retail and professional analysis are blurring.
Learning from the Past, Adapting for the Future
Previous technological leaps, such as the introduction of mobile trading and social trading communities, significantly changed how traders approached the eurusd chart. These advances made analysis accessible, real-time, and collaborative.
To stay ahead, traders must:
- Embrace emerging analytical tools and platforms
- Regularly update their knowledge of global economics
- Test and refine strategies using historical and real-time eurusd chart data
The future of eurusd chart analysis will belong to those who combine adaptability, data-driven insights, and a willingness to leverage the latest technology.
Now that you know how to break down EUR USD charts and spot key trends for 2026, the next step is putting these insights into action with clarity and confidence. With so much volatility ahead, having real time buy and sell signals, instant alerts, and adaptive analysis can make all the difference. If you want to simplify your trading and start making more informed decisions, I recommend giving PipTrend a try on your next trade. Experience the boost in confidence and see how it fits your strategy-Try It On Your Next Trade.
Risk Disclaimer: Trading involves risk. Past performance doesn't guarantee future results. Only trade with money you can afford to lose. PipTrend is a tool to assist your trading decisions, not financial advice.