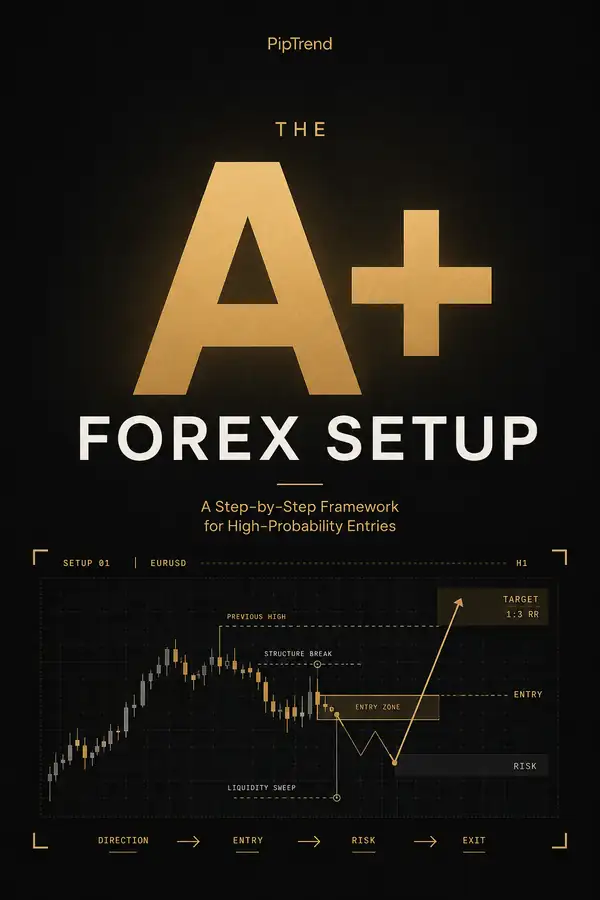
Three Tools. One System. Complete Clarity.
Each indicator in PipTrend has a specific job, show the trend, pinpoint the entry, manage the trade. Here's how they work together.
Smart Signal Engine
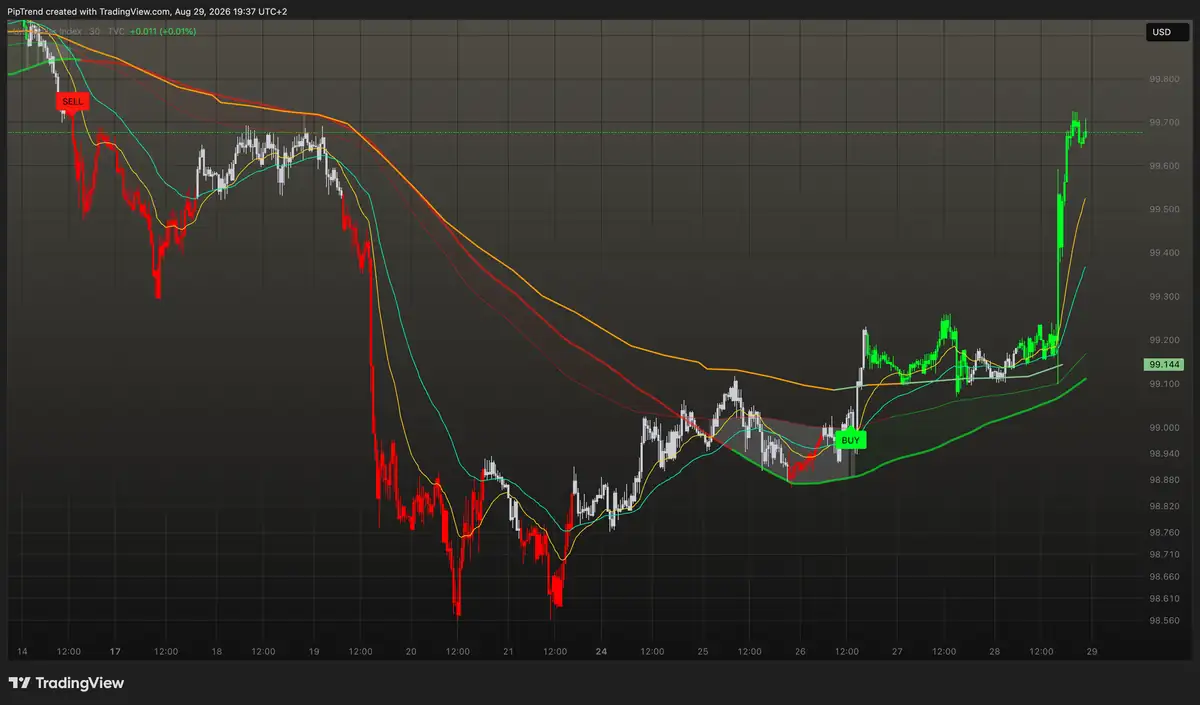
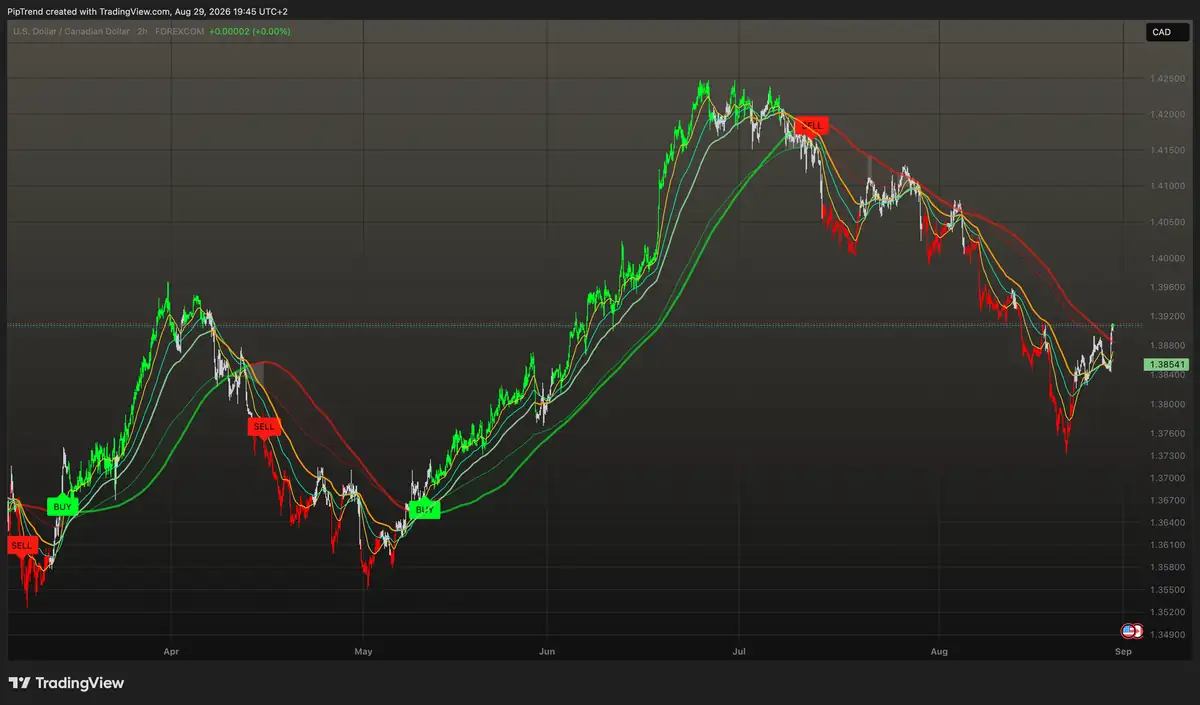
Clear BUY and SELL signals directly on your chart. Color-coded candles show trend direction instantly, green for bullish momentum, red for bearish pressure, gray when the trend is still forming. Built-in fakeout filtering keeps you out of choppy, low-probability setups.
Multi-Timeframe Table
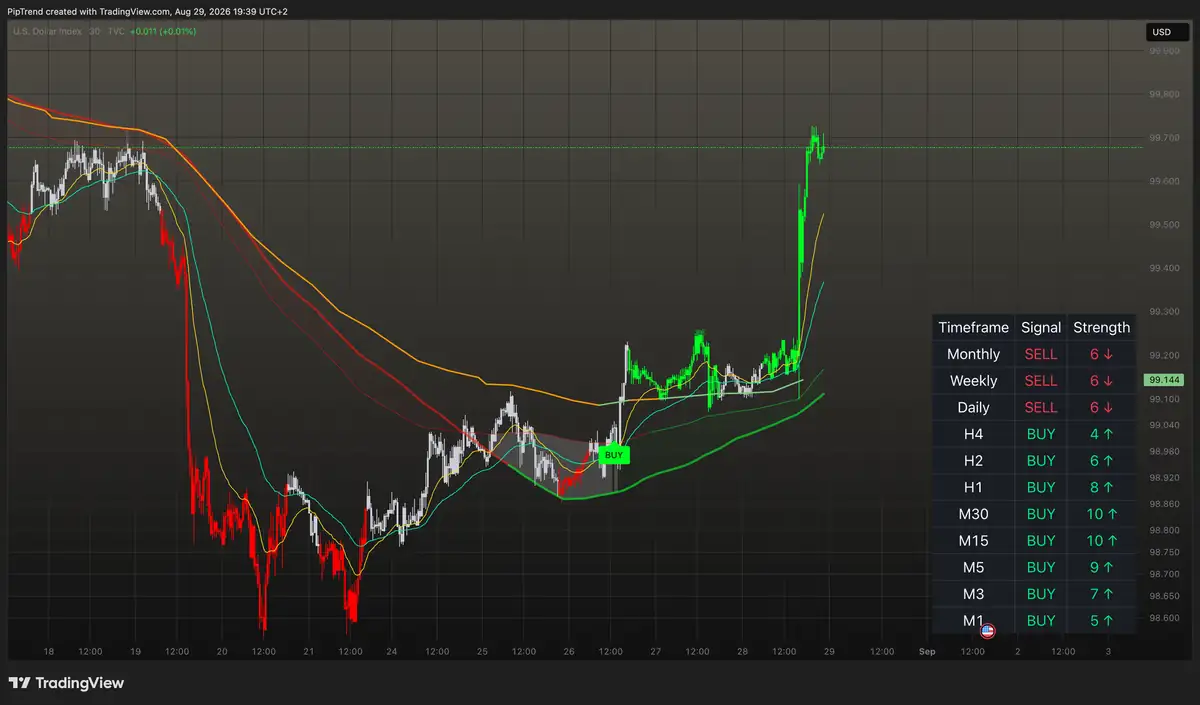
See trend alignment across 12 timeframes at a glance, from 1-Minute to Monthly. The built-in MTF dashboard shows when multiple timeframes agree, so you know when to hold longer and when to take profit. Your trade management tool.
Real-Time Alerts
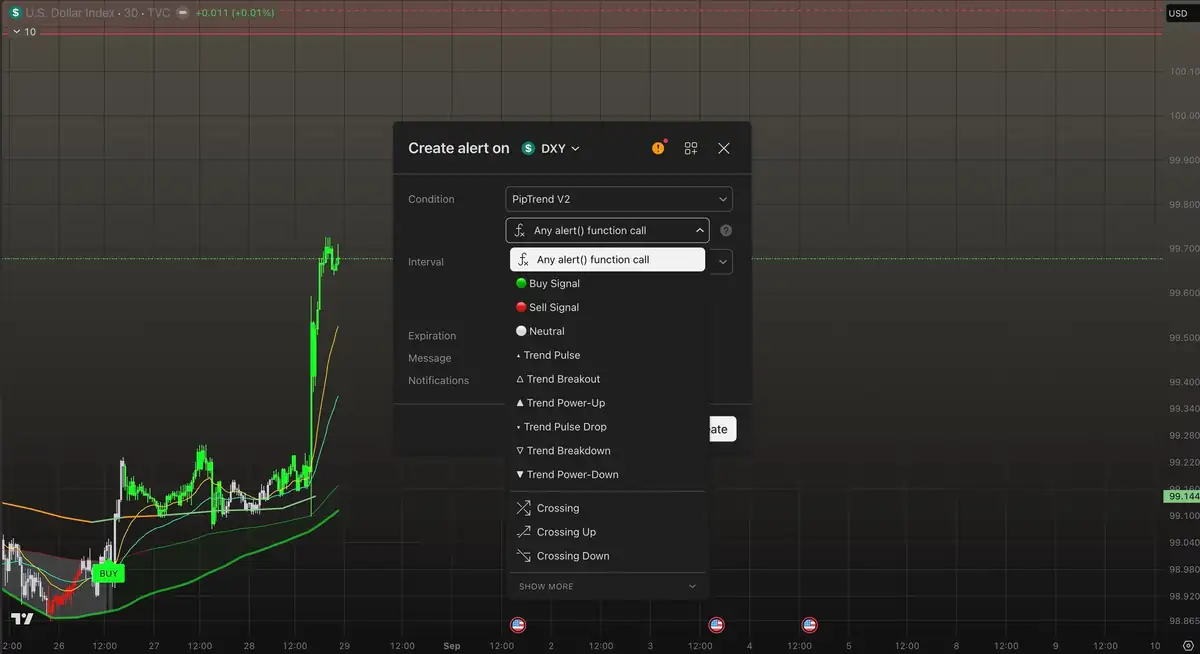
Set it once. Get notified when a setup confirms, by push notification, email, or desktop alert. Configure alerts for any signal type on any timeframe and pair. You choose when and how you get notified.
Non-Repainting Signals
Unlike most indicators, PipTrend signals are locked once the candle closes. They will never disappear, move, or change retroactively. What you see on your chart is exactly what happened in real time.
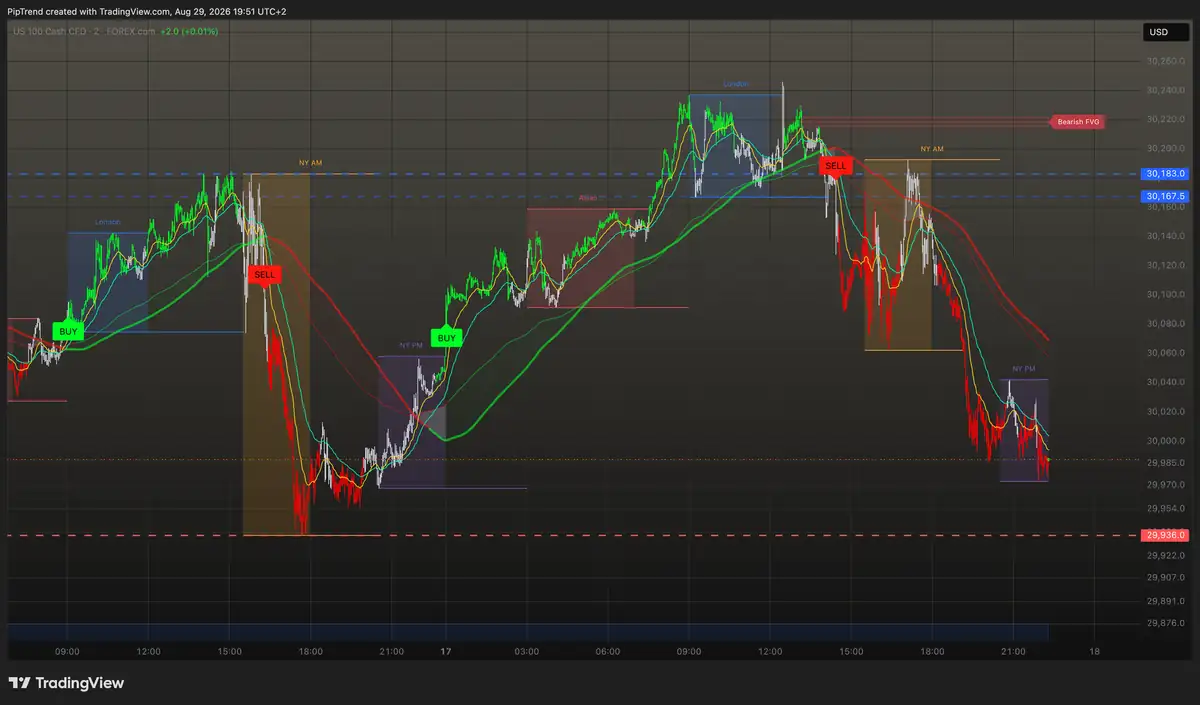
Session Liquidity
Precision entry and exit levels painted directly on your chart. HOD/LOD, Previous Day HOD/LOD, VWAP, supply and demand zones, and fair value gaps, all with automatic killzone highlighting for Asian, London, and New York sessions.
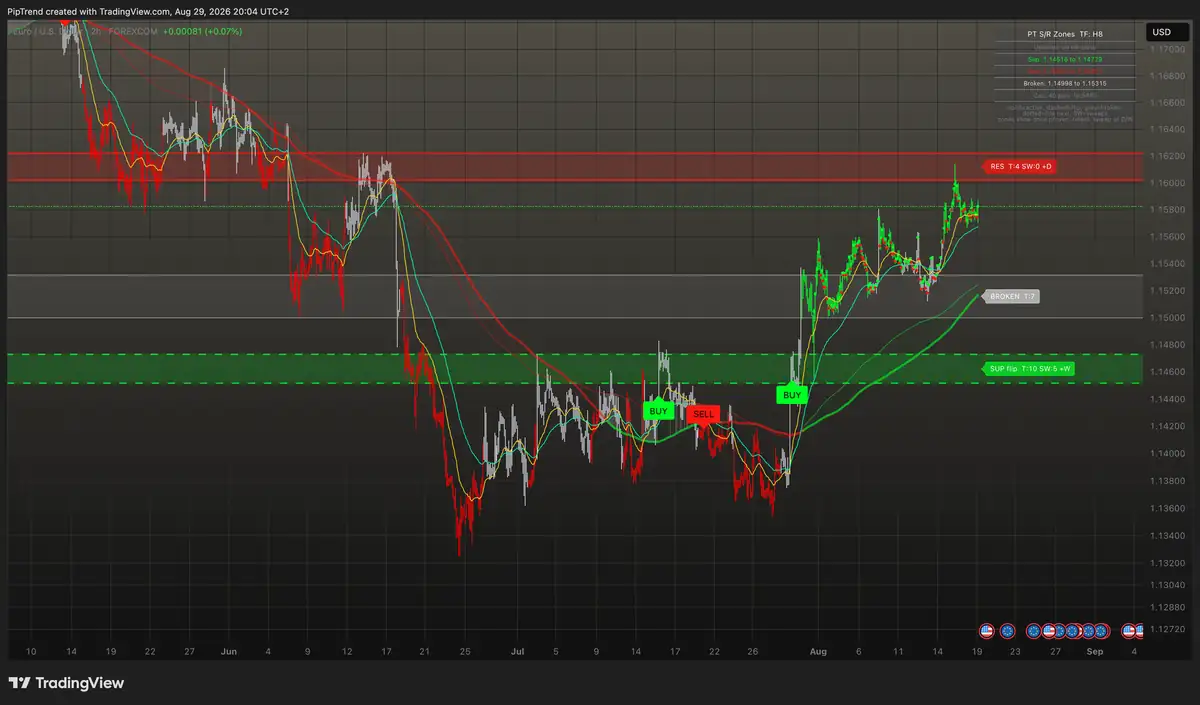
Support & Resistance Zones
Key levels drawn for you from the higher timeframe you choose. A zone only appears once price has proven it, by retest, by sweep, or by lining up with the daily and weekly levels. Each zone carries its touch and sweep count, and updates its own state: solid while active, dashed when it flips from resistance to support, gray once it breaks.
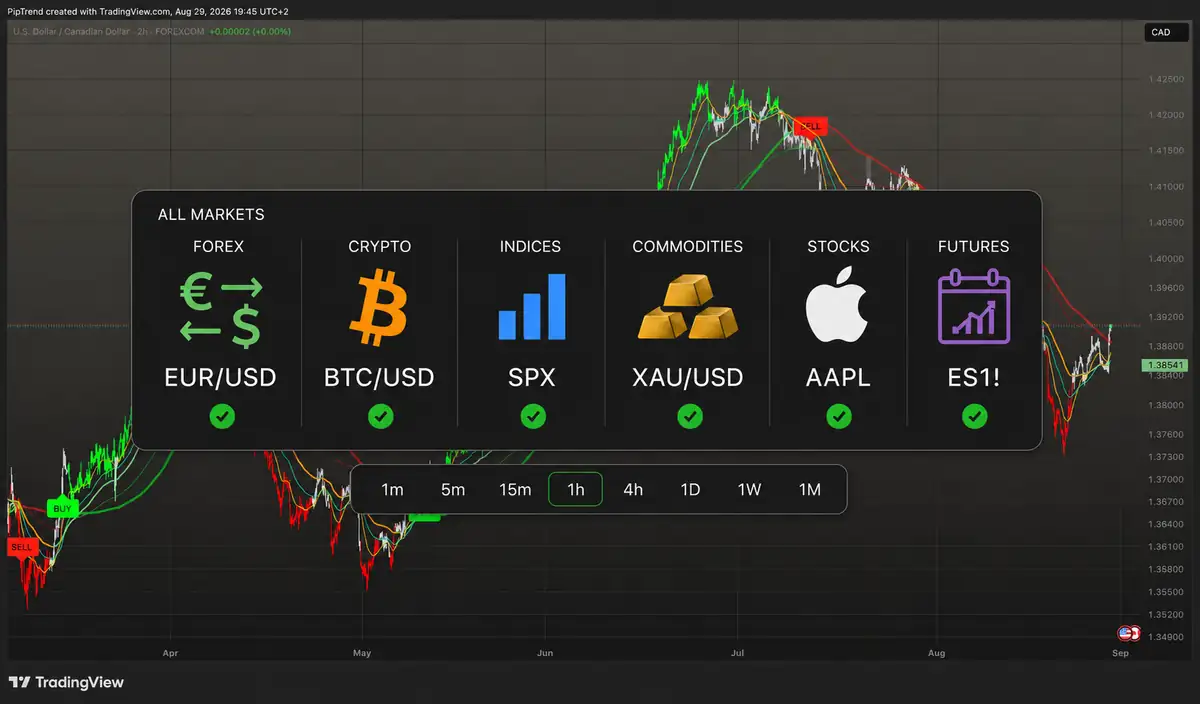
Universal Market Support
One system for every market. PipTrend works seamlessly across Forex, Crypto, Indices, Commodities, and Stocks, on any timeframe from 1-minute scalps to Monthly investor charts.
Why Choose PipTrend?
One system that covers direction, entry, and trade management, so you trade with clarity, not confusion.
Ready to See It In Action?
See how direction, entry, and management work together on your chart.
Secure checkout via Whop · Instant access · 30-day money-back guarantee