timer 40% Price Increase Coming Soon, Lock In Your Rate Today arrow_forward
Blog Login Start Free Trial
check_circle Free

Currency Strength Meter

See which majors are strong and weak right now, and the best pair to trade from that, across your chosen timeframe.

Experimental. This tool is still under development, the rankings can be incomplete or wrong. Treat it as a rough guide, not a trading signal.

Strength
Timeframe
Custom timeframes expand_more
-
ads_click best pair
trade the strongest against the weakest
Strongest -
Weakest -
Timeframes M5 / M15 / H1
Updated -
Loading latest data Free tool by PipTrend
Strength ranking, strongest to weakest
Currency Overall M5 M15 H1

Educational tool, not financial advice. Results depend on your broker's contract specs and pricing. Runs in your browser. Nothing you enter is stored.

Embed This Calculator

Add the Currency Strength Meter to your website or blog. Copy the code below and paste it wherever you want the calculator to appear, it auto-adjusts to fit any container. Please keep the attribution line intact.

help_outline How to use this calculator

  1. 1Choose a preset view, Short-term (M5, M15, H1), Medium-term (M30, H4, D1), or Long-term (H4, D1, W1), or build your own Custom view by picking three timeframes and a bar history.
  2. 2Read the table: each row is a currency (USD, EUR, GBP, JPY, CHF, AUD, NZD, CAD, Gold, Bitcoin). The Overall column shows the total percentage change. The three timeframe columns show a colour-coded strength bar and numeric score from -100 (weakest) to +100 (strongest).
  3. 3Check the "Best pair" callout at the top, it pairs the strongest currency against the weakest for a high-probability trade idea.
  4. 4The table re-sorts automatically on each refresh with the strongest currency at the top. Look for currencies that are strong across all three timeframes, that signals a sustained trend, not just a spike.
  5. 5Use the refresh button to force an immediate update, or let the meter auto-refresh every 5 minutes (real-time mode) or on page load (daily mode).

How Currency Strength Is Calculated Here

Each currency is scored by how its price has moved against a basket of the others. The meter reads the percentage change of nine instrument pairs over your chosen number of candles, attributes that move to both sides (a rising EUR/USD lifts the euro and weighs on the dollar), averages each currency across the basket, then normalizes the result to a -100 to +100 scale so the strongest sits at the top and the weakest at the bottom.

Because the score is relative, it describes rank within the group, not an absolute value: a +80 means strongest right now, not up 80 percent. Changing the timeframe changes the ranking, since a currency can lead on the hourly and lag on the daily, which is exactly why the meter shows three timeframes at once.

On data and delay, the meter is transparent: with a Twelve Data key it uses intraday prices refreshed about every five minutes, and without one it falls back to daily European Central Bank reference rates published around 16:00 CET. Gold and Bitcoin score on the intraday feed only. The status strip always names the current source and delay so you know how fresh the ranking is.

Pairing the Strongest Against the Weakest

The classic use of a strength meter is to buy the strongest currency against the weakest, which is what the best-pair callout does for you. Trading a strong currency against a weak one puts both legs of the pair in your favor, rather than betting on a strong currency against another strong one where the move can stall.

The higher-confidence signal is agreement across timeframes: a currency that leads on all three columns is trending, not just spiking, and a pair built from a consistent leader against a consistent laggard tends to hold its direction longer. Confirm the pair with the correlation matrix and size it with the position size calculator before you act on it.

Which Timeframe Preset Should You Use

PresetTimeframesBest for
ShortM5 / M15 / H1Scalping and intraday
MediumM30 / H4 / D1Swing trading
LongH4 / D1 / W1Position trading
CustomAny threeYour own combination

quiz Frequently Asked Questions

What is a currency strength meter?expand_more
A currency strength meter is a tool that ranks currencies by how much they have gained or lost against a basket of others over a chosen period, so you can see which are strong and which are weak at a glance. This meter scores eight majors plus Gold and Bitcoin from -100 to +100 and highlights the best pair to trade, buying the strongest against the weakest.
How does the currency strength meter work?expand_more
It compares the price change of each currency against all other 9 instruments (8 currencies + Gold + Bitcoin) over the selected number of candles at the selected timeframe. The percentage changes are averaged and normalized to a -100 to +100 scale where +100 is the strongest and -100 is the weakest in the group.
Why do currency strength meters disagree?expand_more
Because strength is relative and depends entirely on the inputs: the basket of instruments, the timeframe, and the number of candles measured. Two meters that use different timeframes or a different set of pairs will rank currencies differently, and neither is wrong. That is why this meter shows three timeframes at once and names its data source, so you can judge the ranking in context rather than trust a single number.
What currencies and assets are tracked?expand_more
Eight major currencies, USD, EUR, GBP, JPY, CHF, AUD, NZD, CAD, plus Gold (XAU) and Bitcoin (BTC). Each is measured against all the others so you can compare any pair.
What do the preset views mean?expand_more
Short-term uses M5, M15, and H1 timeframes, best for scalpers and day traders. Medium-term uses M30, H4, and D1, best for swing traders. Long-term uses H4, D1, and W1, best for position traders. Custom lets you pick any three timeframes and a bar history from 10 to 200.
How often does the data update?expand_more
With a Twelve Data API key configured (free tier), the meter updates every 5 minutes with real-time market data. Without a key, it uses daily data from the European Central Bank, updated once per business day around 16:00 CET.
How do I enable real-time data?expand_more
Sign up for a free Twelve Data account at twelvedata.com, copy your API key, and configure it as the TWELVE_DATA_API_KEY secret. The free tier allows 800 calls per day, which is more than enough for the meter to refresh every 5 minutes.
What does the Overall column show?expand_more
The Overall column shows the actual percentage change of that currency versus all other instruments over the primary timeframe (the first of the three selected). For example, +0.42% means the currency gained an average of 0.42% against the group.

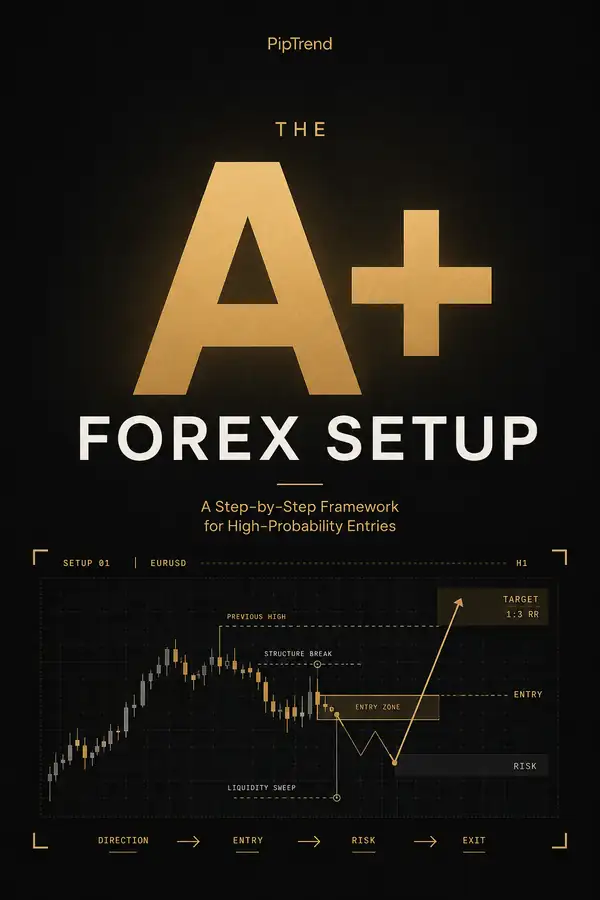
Get the free PipTrend A+ setup guide

We're finishing it now: the exact entries, exits, and risk rules our traders use, on one chart. Leave your email and we'll send it the day it's ready.

grid_view

Explore All Free Tools

Browse our full library of calculators, market tools, and trading resources.

Browse all tools arrow_forward

Want Smarter Signals on Your Chart?

These tools help you plan. PipTrend helps you execute, with a smart signal engine and adaptive trend detection right on your TradingView chart.

Secure checkout via Whop · Instant access · 30-day money-back guarantee