Multi Timeframe Guide: Master Analysis for 2025
On this page
Ever feel like you’re always one step behind the market, missing the best trades or falling for false signals? You’re not alone, many traders struggle to see the full picture when relying on a single chart view.
Imagine if you could anticipate market moves by analyzing trends from every angle. That’s where multi timeframe analysis comes in. This guide will show you how mastering multi timeframe analysis can give you a powerful edge, helping you optimize entries, exits, and risk management in 2025 and beyond.
Ready to unlock deeper insights and confidently navigate any market? Let’s dive in.
What is Multi-Timeframe Analysis?
Ever wonder why some traders always seem to catch the right moves while others get whipsawed out of the market? The answer often comes down to perspective. Multi timeframe analysis (MTA) is the practice of examining price action and market trends across several chart timeframes to gain a complete, 360-degree view of what’s really happening.
Markets are fractal by nature, meaning patterns repeat at every scale, from minutes to months. Each timeframe tells a different part of the story: the big picture, the current environment, and the fine details. By combining these perspectives, multi timeframe analysis helps traders filter out noise and tune into the signals that matter most.
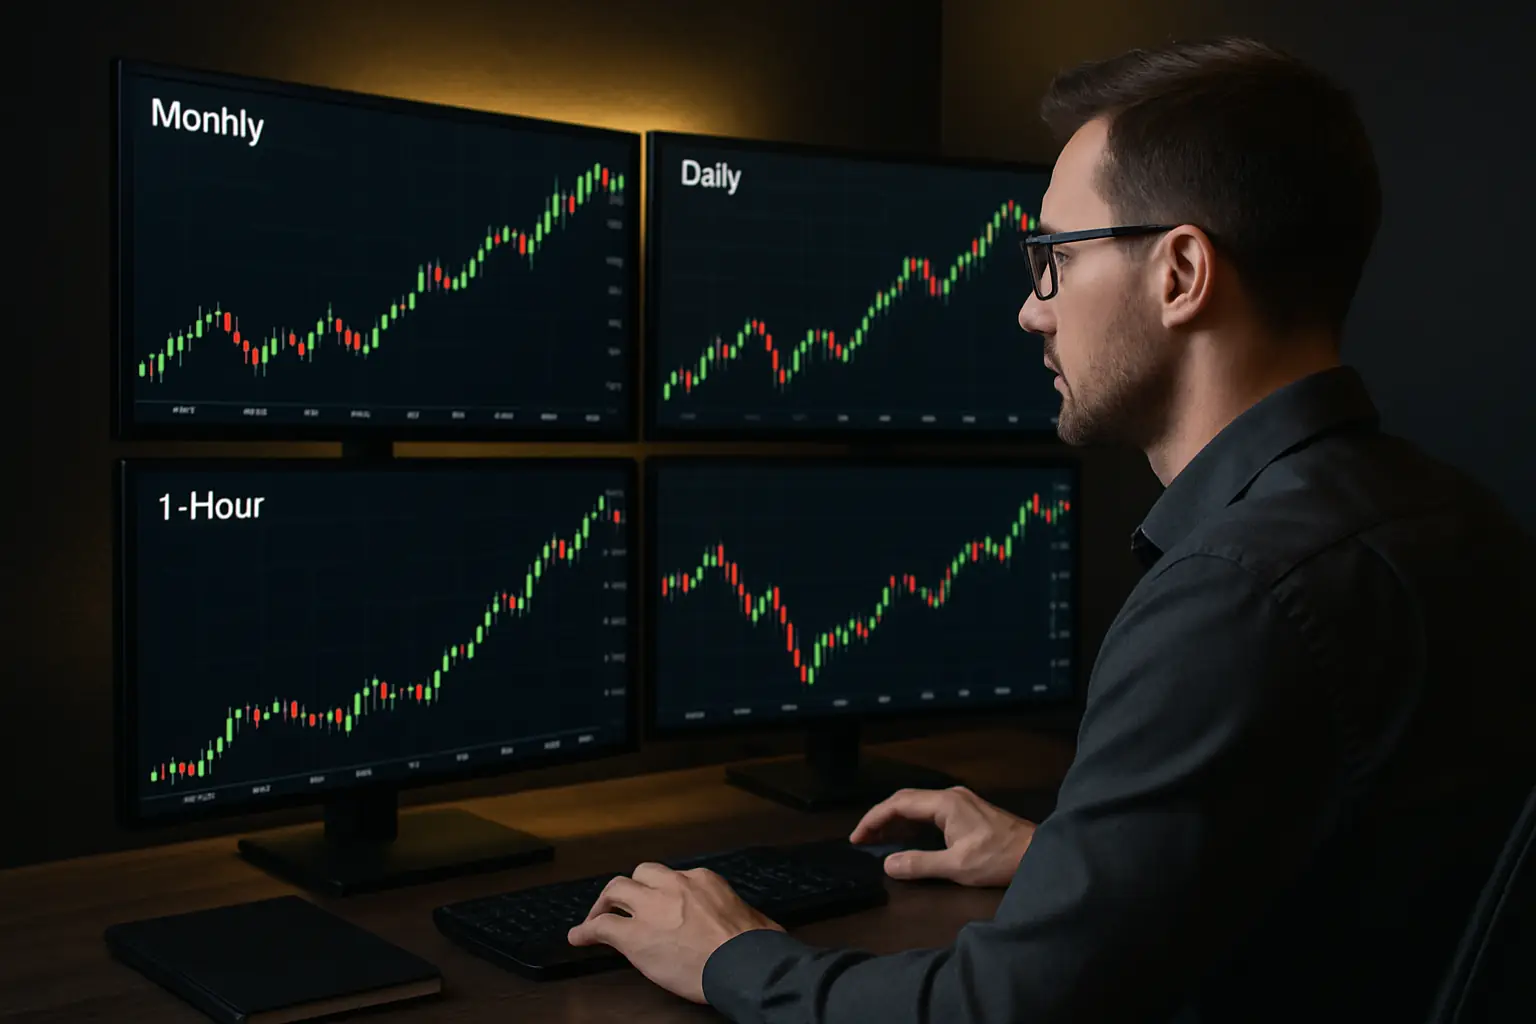
The Three Core Timeframes
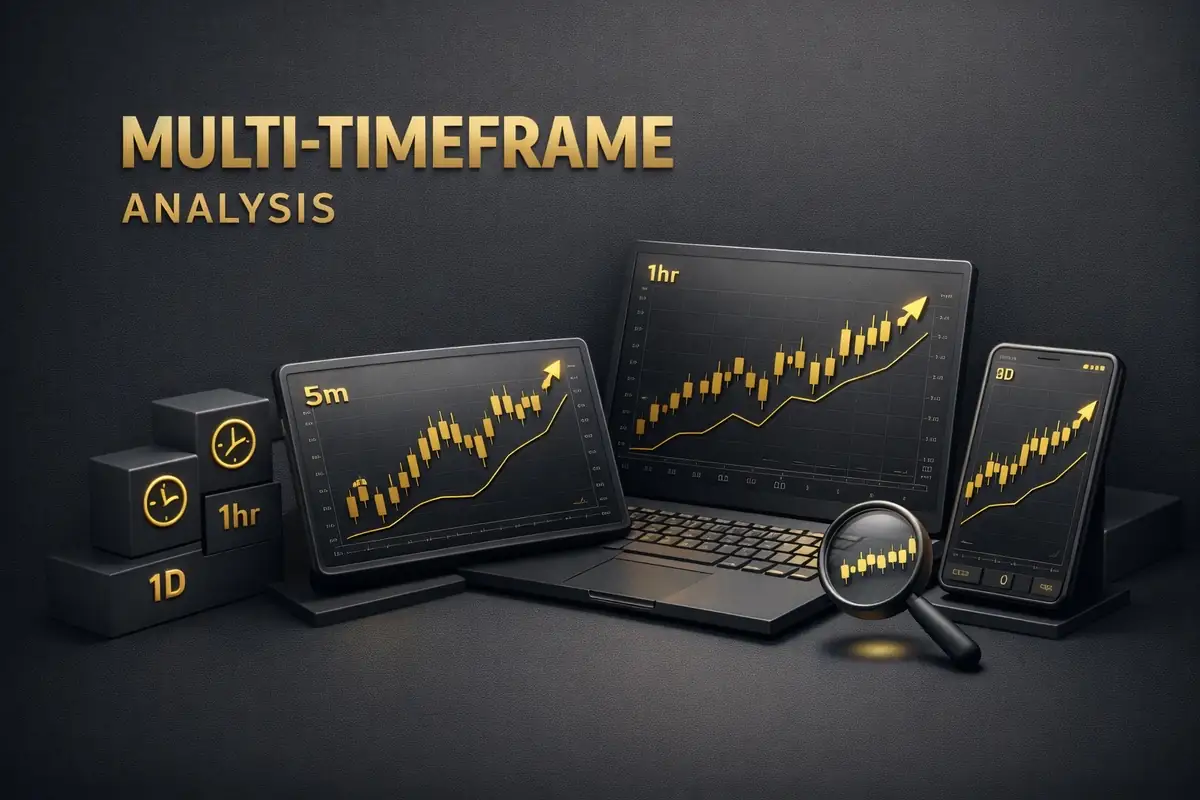
To master multi timeframe analysis, traders typically use a trio of chart views:
- Higher timeframe: Monthly or weekly charts for the overall trend.
- Intermediate timeframe: Daily or 4-hour charts for medium-term corrections and structure.
- Lower timeframe: 1-hour or 15-minute charts for pinpointing entries and exits.
Here’s a quick summary:
| Timeframe | Purpose | Example Use |
|---|---|---|
| Higher (Monthly/Weekly) | Identify long-term trend, major support/resistance | Spot if the market is bullish or bearish overall |
| Intermediate (Daily/4H) | Analyze corrections, consolidations | Find pullbacks or emerging patterns |
| Lower (1H/15M) | Time entries & exits, confirm signals | Enter trades at optimal moments |
By layering these views, multi timeframe analysis reveals not just where the market is going, but also when and how to act on it.
Why Multi Timeframe Analysis Works, and Common Mistakes
Let’s look at a real example. Imagine you spot a bullish reversal on the 1-hour chart. It’s tempting to jump in, but if the daily and weekly charts are in a strong downtrend, your trade could quickly turn against you. Multi timeframe analysis prevents this by ensuring your lower timeframe signals align with the bigger trend.
Both Oanda and LuxAlgo stress that syncing your analysis across multiple timeframes reduces false signals and improves accuracy. For instance, Oanda’s guide on multi timeframe analysis shows that confirmation across charts leads to better entries and exits.
Common mistakes include over-reliance on a single timeframe, leading to whipsaws, poor timing, and missed opportunities. That’s why traders use either a top-down approach (starting from higher timeframes and working down) or a bottom-up approach (spotting opportunities on lower charts, then confirming with higher ones), depending on their strategy and goals.
In short, multi timeframe analysis is the secret weapon for seeing the market’s full story, helping you avoid costly mistakes and make smarter, more confident trades.
Why Multi-Timeframe Analysis Matters in 2025
Imagine trading in 2025 without seeing the full market picture, like driving with one eye closed. The stakes are higher than ever, and relying on a single timeframe could leave you vulnerable to rapid market shifts. Understanding why multi timeframe analysis is essential now can transform your entire trading approach.

The Evolving Market Landscape
In 2025, financial markets are more dynamic and unpredictable than ever. Volatility has surged, driven by global events and the widespread use of algorithmic trading systems. These algorithms react in milliseconds, exploiting even the smallest inefficiencies, making it harder for traders who only rely on one chart.
Multi timeframe analysis is now a necessity, not a luxury. By examining different time horizons, you can see both the forest and the trees, spotting big-picture trends and short-term fluctuations. With the explosion of adaptive tools, processing multi timeframe data has become faster and more accurate, providing traders with insights that were impossible just a few years ago.
The multi timeframe approach also helps you avoid the common pitfall of tunnel vision. When news breaks or markets move sharply, traders anchored to a single timeframe can be caught off guard. By integrating multiple perspectives, you’re better prepared to anticipate market moves and adapt your strategy in real time.
Key Benefits of Multi-Timeframe Analysis
Why do so many top traders swear by multi timeframe analysis? The answer lies in the layered advantages it provides:
- Enhanced trade timing: Aligning signals across timeframes means you enter and exit trades with greater precision.
- Stronger risk management: Higher timeframe support and resistance levels help you set more reliable stop-losses and targets.
- Signal validation: Cross-checking signals filters out noise, reducing the risk of false positives.
- Adaptability: Multi timeframe analysis works across all markets, forex, stocks, crypto, and indices.
- Flexibility for all trading styles: Day traders, swing traders, and long-term investors can all benefit.
For example, a trader sees a pullback on the 4-hour chart within a strong weekly uptrend. By waiting for confirmation across multiple timeframes, they avoid low-probability trades and focus on high-probability setups.
According to Multi-Timeframe Analysis: The Key to Better Trading Decisions, traders who consistently use multi timeframe analysis report improved timing and reduced losses, making it a cornerstone of modern trading success.
Common Pitfalls Without MTA
Ignoring multi timeframe analysis can quickly lead to costly mistakes. Some of the most common pitfalls include:
- Overtrading: Short-term charts generate lots of signals, many of which are just market noise.
- Missing the macro trend: Without the broader context, you risk trading against the dominant direction and getting stopped out.
- Getting whipsawed by news: Traders who focus only on 15-minute charts during major events often experience rapid reversals and unpredictable price swings.
Consider the trader who enters a position based solely on a 15-minute signal during a high-impact news event. Without the confirmation of higher timeframes, they’re far more likely to be whipsawed out of the trade. Using multi timeframe analysis helps you filter out this noise and stay aligned with the markets’ true direction.
Step-by-Step Multi-Timeframe Analysis Process
Unlocking the full power of multi timeframe analysis means following a structured process, one that brings clarity, discipline, and confidence to every trade. Let’s break down each step so you can master this vital skill and see the market from every angle.

1. Identify the Long-Term Trend
Begin your multi timeframe analysis on the highest relevant chart, usually monthly or weekly. This big-picture view reveals the overall market direction that should guide your trading decisions.
- Scan for classic trend patterns: higher highs/lows for uptrends, lower highs/lows for downtrends.
- Mark major support and resistance zones that have held for months.
- Overlay moving averages (like the 50 or 200 MA) to confirm the dominant momentum.
- Use indicators such as RSI to spot overbought or oversold extremes.
A table like the one below can help you map out your long-term signals:
| Timeframe | Trend Type | Key Indicator | Support/Resistance Example |
|---|---|---|---|
| Monthly | Macro-trend | 200 MA, RSI | Multi-year high/low |
| Weekly | Primary trend | 50 MA, Trendlines | Major swing points |
If you’re new to this process, The Essential Guide To Multi-Timeframe Analysis offers practical examples and deeper insights into this foundational step.
2. Analyze the Medium-Term Structure
Shift down to the daily or 4-hour chart. Here, your goal is to understand corrections, consolidations, or reversals within the larger move revealed by your multi timeframe approach.
- Identify swing points and retracements, are they shallow or deep?
- Draw trendlines or channels to spot emerging patterns.
- Look for alignment: Does the medium-term structure support the long-term trend, or is there divergence?
- Use indicators like MACD for momentum shifts.
A well-aligned medium-term chart means your trade ideas have added conviction, minimizing the risk of trading against the prevailing multi timeframe trend.
3. Pinpoint Short-Term Opportunities
Now, zoom into the 1-hour or 15-minute charts to refine your entries and exits. This is where multi timeframe analysis pays off, letting you act with precision.
- Look for candlestick patterns (like engulfing or pin bars) at key levels.
- Map out micro-support and resistance based on recent price action.
- Use fast indicators, stochastic, MACD, or short moving averages, for quick momentum reads.
- Wait for confirmation: Only act when the short-term signal fits the bigger picture.
For example, a bullish engulfing candle on the 1-hour chart at a weekly support level shows the power of multi timeframe confluence.
4. Cross-Check and Validate Signals
Never trade in isolation. Multi timeframe analysis is about confirmation.
- Only consider trades when at least two timeframes agree on direction and setup.
- If your lower timeframe contradicts the higher one, stay on the sidelines.
- Add volume or volatility analysis to further validate signals.
- Double-check: Is the RSI overbought or oversold across both daily and 4-hour charts? Is the trendline respected on all levels?
This disciplined approach filters out noise and dramatically reduces false signals in your multi timeframe workflow.
5. Manage Risk with Multi-Timeframe Context
Risk management is where many traders go wrong, but multi timeframe analysis can help you avoid common pitfalls.
- Place stop-losses beyond higher timeframe support or resistance, not just intraday swings.
- Adjust your position size based on volatility seen across different timeframes.
- Use take-profit targets at major levels identified on weekly or daily charts.
For instance, placing a stop below weekly support, rather than just a 15-minute low, protects you from normal market fluctuations, enhancing your multi timeframe risk strategy.
6. Document and Review Each Step
Consistency and learning are key to mastering multi timeframe trading.
- Keep a detailed journal of each trade, noting observations and decisions at every timeframe.
- After each week, review for missed signals or alignment issues.
- Look for patterns in your results, are certain timeframe combinations yielding better trades?
Sample journal entry:
Trade: EUR/USD
Long-Term (Weekly): Uptrend, support at 1.0600
Medium-Term (Daily): Retracement to support, bullish MACD
Short-Term (1h): Bullish engulfing, entry at 1.0620
Result: +50 pips. Multi timeframe alignment confirmed.
Regular review and documentation can increase your win rate by up to 20%-a testament to the power of a disciplined multi timeframe process.
Essential Tools and Platforms for Multi-Timeframe Analysis
Navigating the world of multi timeframe trading requires the right set of tools. With markets evolving rapidly, traders need platforms and indicators that make multi timeframe analysis seamless, efficient, and actionable. Below, we break down the most effective solutions and features for mastering this essential trading skill.
Charting Platforms
A reliable charting platform is the cornerstone of any multi timeframe strategy. Traders need tools that allow for easy switching between timeframes and comprehensive chart overlays. Here’s a quick comparison of the most popular platforms:
| Platform | Key Features | Best For |
|---|---|---|
| TradingView | Multi-chart layouts, synchronized timeframes, indicator-rich | All asset classes |
| MetaTrader 4/5 | Custom indicators, scriptable, forex-focused | Forex traders |
| Oanda | Advanced charting, broker integration | Forex, indices, stocks |
TradingView stands out for its multi timeframe charting capabilities, letting users view and compare several timeframes simultaneously. MetaTrader 4/5 is favored for forex due to its robust multi timeframe indicator support. Broker platforms like Oanda integrate execution with analysis, streamlining the trading process.
Technical Indicators for MTA
Technical indicators are vital for interpreting price action across multiple timeframes. When applied correctly, they can confirm trends and spot high-probability trade setups.
- Moving Averages: Help define the broader trend and dynamic support/resistance across each multi timeframe chart.
- RSI/MACD/Stochastic: Confirm momentum and highlight divergences or overbought/oversold conditions.
- Fibonacci Retracement: Identifies confluence zones where price may react on different timeframes.
- Volume Profile: Reveals liquidity clusters, helping filter out noise in multi timeframe analysis.
Combining these indicators on several timeframes increases confidence in your trade decisions and ensures you’re not blindsided by conflicting signals.
Adaptive Tools
AI-driven platforms have revolutionized multi timeframe trading by automating data analysis and signal detection. These tools scan multiple assets and timeframes in seconds, offering objective, actionable insights.
Key benefits of adaptive multi timeframe tools include:
- Instant trend detection and signal generation across all relevant timeframes.
- Automated alerts for trade setups aligned with multi timeframe context.
- Reduction of human error and emotional trading, thanks to unbiased analysis.
AI tools are especially valuable in fast-moving markets, enabling traders to focus on execution rather than manual chart scanning. Integrating AI with traditional multi timeframe strategies can dramatically improve timing and consistency.
How PipTrend Simplifies Multi-Timeframe Analysis
For traders seeking a streamlined approach to multi timeframe trading, adaptive multi-timeframe tool stands out as a top solution. PipTrend delivers real-time buy and sell signals across forex, crypto, stocks, and indices, all visualized on an intuitive dashboard.
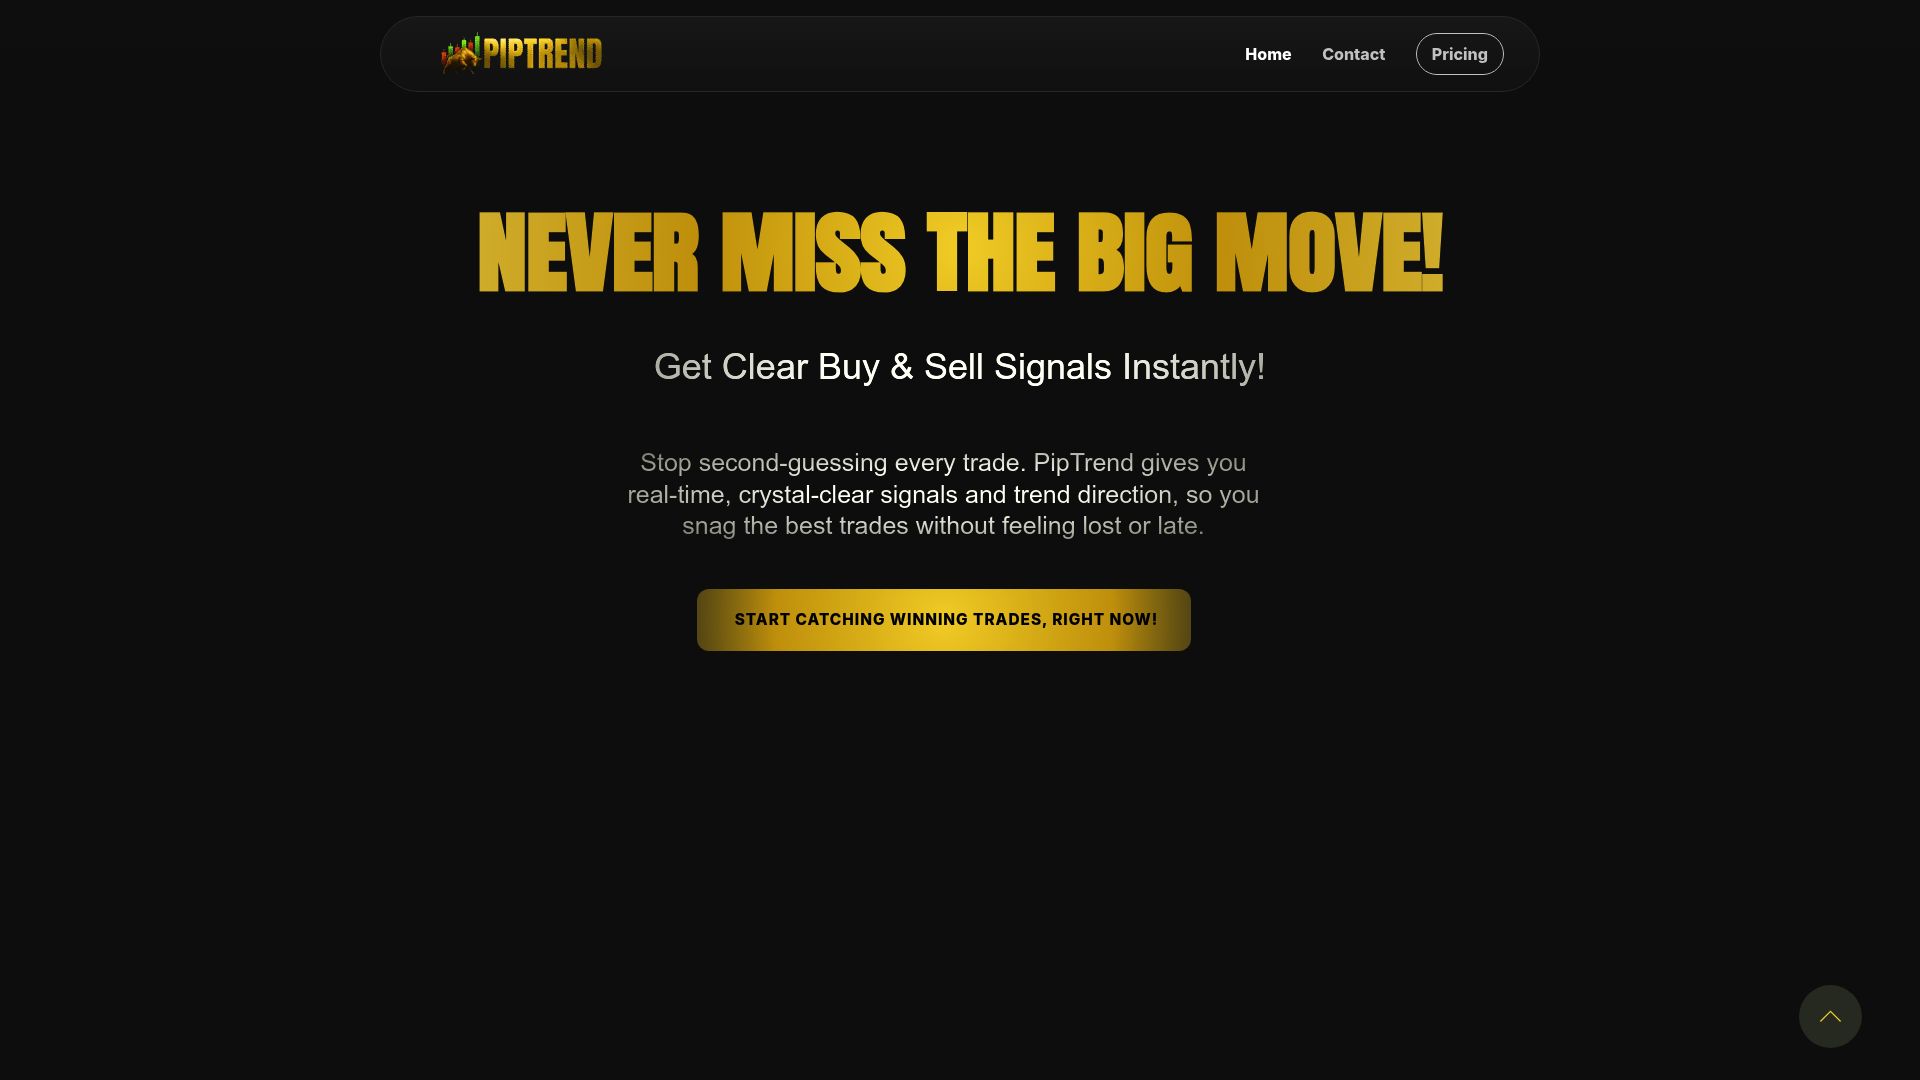
Key features:
- Multi timeframe trend alignment at a glance, reducing the risk of trading against the dominant move.
- Instant mobile and desktop alerts based on multi timeframe signals.
- Automatic trend detection and session liquidity overlays for precise entries and exits.
PipTrend is beginner-friendly, integrates with TradingView, and empowers both day and swing traders to make smarter decisions. Most users report more consistent wins and greater confidence in their multi timeframe analysis from the very first week.
Advanced Strategies for Mastering Multi-Timeframe Analysis
Unlocking the true potential of multi timeframe trading requires more than just glancing at a few charts. Mastery comes from using advanced strategies that tie together trend, confirmation, risk, and adaptability, turning raw market data into actionable insights. Let’s break down the most effective techniques for elevating your multi timeframe approach in 2025.
Trend Alignment and Trade Filtering
Trading with the prevailing trend across multiple timeframes is the cornerstone of consistent results. Start by analyzing the higher timeframe, such as the weekly chart, for overall market direction. Only consider trades that align with this broader trend.
Apply the “three-screen” method:
- Higher timeframe: Identify the primary trend.
- Middle timeframe: Spot corrections or consolidations.
- Lower timeframe: Pinpoint precise entries.
By filtering trades through this multi timeframe lens, you avoid fighting the dominant market flow. For those looking to systematize this process, Trading resources and guides offer practical templates and step-by-step instructions tailored for multi timeframe strategies.
Signal Confirmation and Layering
Don’t act on a signal from just one chart. Wait for confirmation across at least two timeframes to strengthen your conviction. For example, a MACD bullish cross on the daily chart means little if the 4-hour chart shows bearish momentum.
Layer indicators for robust confirmation:
- MACD and RSI alignment
- Price action in agreement with moving averages
- Consistent volume spikes across timeframes
This approach reduces the risk of false entries and helps you focus only on high-probability multi timeframe setups.
Risk Management Integration
Advanced multi timeframe traders use higher timeframe support and resistance to set smarter stop-loss and take-profit levels. Placing a stop just below a daily swing is less effective than anchoring it beneath a weekly support zone.
Adjust your position size based on volatility observed across all relevant timeframes. This minimizes the chance of being stopped out by normal price fluctuations and keeps your risk consistent.
| Approach | Pros (Multi Timeframe) | Cons (Single Timeframe) |
|---|---|---|
| Stop/TP placement | Based on major S/R, robust | Prone to noise, too tight |
| Position sizing | Adjusted for volatility | Misses big-picture shifts |
Pattern and Indicator Confluence
Look for overlapping chart patterns, such as a head and shoulders on both the daily and 4-hour charts. When Fibonacci retracement levels from multiple timeframes cluster together, they form powerful support or resistance zones.
Multi timeframe confluence isn’t just about patterns. It’s about stacking evidence. A recent research paper explores how multi-timescale activity reveals deeper market structure, underscoring the value of this approach for advanced traders.
Adapting to Market Conditions
Market conditions evolve, so should your multi timeframe strategy. During major news events, short-term charts can become erratic. In these moments, rely more on higher timeframe analysis to avoid getting whipsawed by volatility.
When markets trend smoothly, use lower timeframes to fine-tune your entries. In sideways or choppy markets, stick to signals from higher timeframes for greater reliability.
Journaling and Continuous Improvement
Every multi timeframe setup you trade is a learning opportunity. Keep a detailed journal noting:
- The timeframes used
- The signals and patterns observed
- Entry, exit, and outcome
Regularly reviewing your trades helps you identify which combinations deliver the best results. Over time, you’ll refine your multi timeframe strategy, adapting it to changing market dynamics while steadily improving your performance.
Practical Application: Real-World Multi-Timeframe Analysis Examples
Unlocking the full potential of multi timeframe analysis means seeing how it works in real markets. Let’s break down practical examples and show how you can apply these strategies, whether you trade forex, crypto, or other assets.
Case Study: Forex (USD/CAD)
Imagine analyzing USD/CAD using a multi timeframe approach. On the monthly chart, you notice a strong uptrend, with price bouncing off a long-term trendline. This gives you the macro perspective.
Switching to the weekly chart, you spot a narrowing channel and see the RSI signaling overbought conditions. This suggests potential for a pullback, so you become more cautious.
Next, the daily chart reveals a decisive break below key moving averages, with support zones coming into play. You wait for confirmation on the 4-hour and 1-hour charts, perhaps a bullish engulfing candle or a MACD cross before entering.
By aligning all these signals, your multi timeframe analysis increases confidence and reduces the risk of trading against the prevailing trend.
Case Study: Crypto (BTC/USD)
For BTC/USD, start with the monthly chart to define the macro trend, let’s say it’s a long-term uptrend with major resistance overhead. This sets your trading bias.
On the daily chart, you track pullbacks toward critical moving averages. If price approaches daily support, you watch for reversal patterns.
Dropping to the 1-hour chart, you spot a bullish engulfing candle right at that daily support. This is your entry cue, backed by evidence from every timeframe.
This multi timeframe process helps crypto traders avoid false signals and act only when higher and lower timeframes align.
Quantitative Outcomes
Using a multi timeframe strategy delivers measurable results. According to LuxAlgo, traders who consistently analyze three timeframes see higher win rates and fewer false entries.
Oanda’s data shows that filtering trades through multiple timeframes can improve risk/reward ratios significantly. In fact, most experts agree that three is the optimal number, enough for clarity, not so many that you get confused.
For those seeking more insights and the latest strategies, check out the Latest trading blog articles for real-world updates and advanced tips on multi timeframe trading.
Tips for Implementation
Ready to put multi timeframe analysis into practice? Start by demo trading, so you can refine your approach without risking real capital.
Leverage platform features like multi-chart layouts and synchronized cursors to streamline your workflow. Tools like comprehensive trading tools and templates help you set up consistent charts for each asset and timeframe.
Above all, review and refine your process regularly. The best multi timeframe traders treat analysis as an evolving skill, always looking for ways to improve clarity and results.
Ready to put multi-timeframe analysis into action and see real results in your trading? You don’t have to figure it all out alone, PipTrend gives you instant, adaptive signals across forex, crypto, stocks, and indices, making it simple to spot high-probability setups and avoid second-guessing. If you want to trade with more confidence and consistency in 2025, why not see how much easier it can be when the right tools do the heavy lifting? Give yourself the edge you deserve-See Your Trading Improve With PipTrend.
Risk Disclaimer: Trading involves risk. Past performance doesn't guarantee future results. Only trade with money you can afford to lose. PipTrend is a tool to assist your trading decisions, not financial advice.