Top 10 TradingView Indicator Picks for Smarter Trading 2026
On this page
Scrolling through TradingView can feel overwhelming, with thousands of tradingview indicator options promising smarter trades for 2026. But how do you know which ones truly deliver results? In this article, we unveil the top 10 tradingview indicator picks designed to give traders a meaningful edge in today’s fast-changing markets.
Our selections blend time-tested classics with innovative tools, each chosen for their strengths in trend detection, momentum, volatility, and actionable signals. Exclusive insights and real trader testimonials back up these choices, showing measurable improvements in confidence and outcomes. Ready to trade smarter? Explore each indicator’s unique value and see how the right toolkit can transform your strategy.
How to Choose the Best TradingView Indicators for 2026
Selecting the right tradingview indicator can make the difference between confident decisions and costly mistakes. With TradingView’s vast library, traders are often overwhelmed by options. How do you narrow down the best tools for your unique strategy in 2026?
Align Indicators With Your Trading Goals
Start by clarifying your trading objectives. Are you focused on day trading, swing trading, scalping, or long-term investing? Each style demands a different tradingview indicator setup.
For example, day traders often prefer fast-reacting momentum or volatility tools, while investors may lean toward trend-following and volume-based indicators. Matching indicators to your goals ensures you get actionable, timely signals rather than conflicting noise.
Consider Market Conditions and Asset Classes
Next, assess the current market environment. Is the market trending or ranging? Are you trading forex, crypto, stocks, or indices? Some indicators excel in high-volatility markets, while others shine during stable periods.
A tradingview indicator like the Supertrend works well in trending conditions, whereas oscillators such as RSI or WaveTrend help in sideways markets. Asset class matters too, crypto traders might favor volatility and momentum tools, while stock traders often rely on volume analysis.
Build a Balanced Toolkit for 2026
Creating a balanced indicator toolkit is critical. Aim to include at least one trend, momentum, volatility, and volume-based tradingview indicator. This mix helps you capture a fuller market picture and reduces the risk of bias.
Avoid crowding your chart with too many signals, which can lead to analysis paralysis. Successful traders often combine two or three complementary indicators, such as a moving average with RSI or Ichimoku paired with ATR. For deeper insights on toolkit selection and the latest innovations, the Best TradingView Indicators Guide offers an in-depth resource.
Keep in mind, TradingView’s recent updates and Pine Script enhancements now allow for greater customization and smarter automation. Take advantage of these features to fine-tune your toolkit for 2026’s evolving markets.
Combine, Customize, and Backtest for Performance
No single tradingview indicator is perfect. The top performers adapt their settings to suit personal strategies and changing market conditions. Use TradingView’s backtesting tools to validate indicator combinations before risking real capital.
Learn from top traders who emphasize simplicity and mastery over quantity. Focus on a few high-quality indicators, tweak parameters, and test them rigorously. Custom scripts or modified versions can give you an extra edge.
Remember, the goal is clarity and actionable signals. A well-curated set of indicators, properly combined and tested, can transform your trading confidence in 2026.
Top 10 TradingView Indicator Picks for Smarter Trading 2026
Navigating the vast TradingView indicator landscape can feel overwhelming, especially with new features and scripts emerging every year. To ensure you are equipped for smarter trading in 2026, we have curated a shuffled list of the top 10 TradingView indicator picks. Each was selected for its proven reliability, innovative approach, and adaptability to today’s fast-moving markets.
Below, you will find a blend of classic and cutting-edge tools, each offering unique strengths for trend detection, momentum tracking, volatility analysis, and actionable signal generation. Whether you are a day trader, swing trader, or investor, these TradingView indicator choices can help you make more informed decisions.
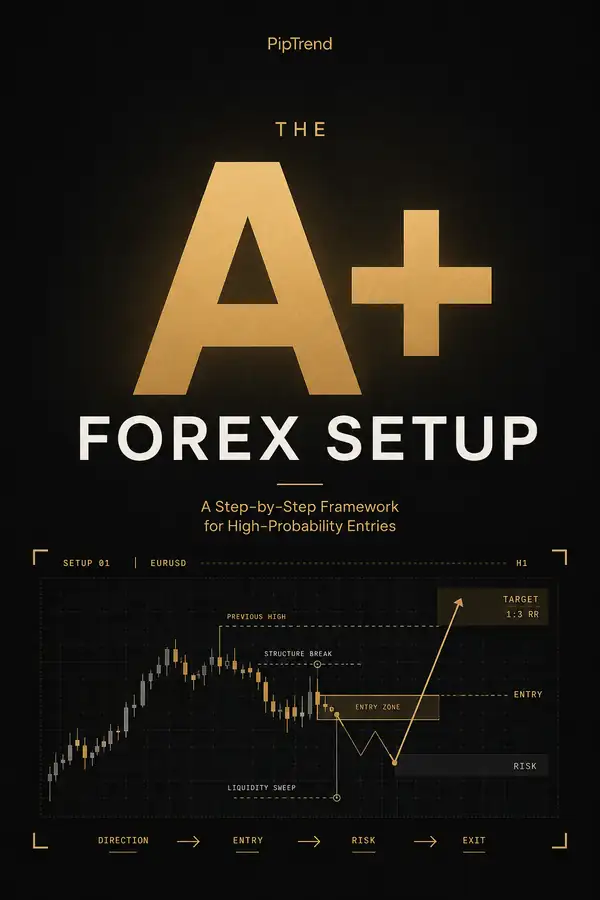
PipTrend AI Indicator
The PipTrend AI Indicator is a next-generation tradingview indicator that leverages artificial intelligence for real-time buy and sell signals. Its multi-timeframe analysis and customizable alerts make it universally compatible across forex, crypto, stocks, indices, and commodities.
Key features include:
- adaptive signal generation
- Instant mobile alerts
- User-friendly interface
- Lifetime updates with subscription
Unique benefits: The indicator removes guesswork from trading, reduces overtrading, and is especially accessible for beginners. Day traders and swing traders benefit from its clarity, while advanced users appreciate its automation.
Pros:
- High accuracy and reliability
- Easy setup and integration
- Active community support
Cons:
- Requires a paid subscription
- Needs an active TradingView account
Example: 92% of users report more winning trades within the first week, while 93% note reduced trading stress. This tradingview indicator stands out by combining advanced AI with TradingView’s robust ecosystem, empowering traders to act confidently in volatile markets.
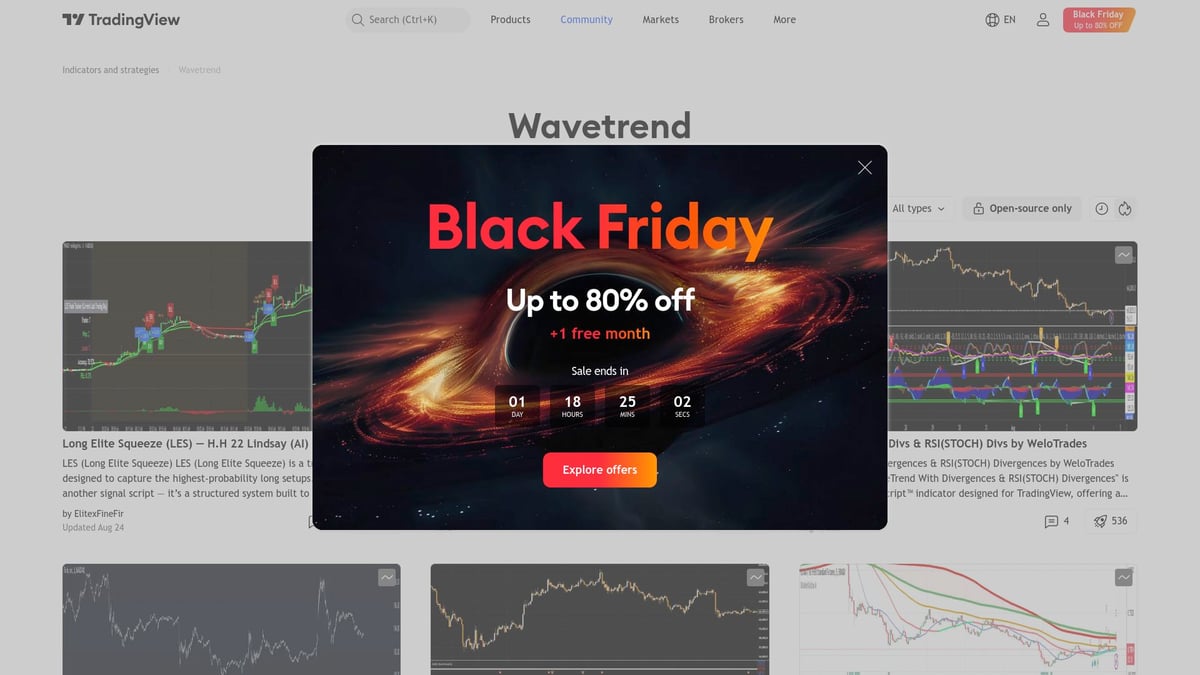
WaveTrend Oscillator [WT]
The WaveTrend Oscillator is a free, community-driven tradingview indicator known for detecting trend reversals and momentum shifts swiftly. Its algorithm excels in both trending and ranging markets, providing early signals with less lag than traditional oscillators.
![Top 10 TradingView Indicator Picks for Smarter Trading 2026 - WaveTrend Oscillator [WT]](https://xqvnmkjynbkcujcrtubi.supabase.co/storage/v1/object/public/article-images/3358d4ad-f963-43dd-9f57-0a2d296e3bc1/1764250497501-https___www_tradingview_com_scripts_wavetrend_.jpg)
Features:
- Early detection of reversals
- Momentum shift identification
- Highly customizable settings
Benefits: This indicator is popular among crypto and forex traders aiming to catch reversals at market tops and bottoms. Its versatility makes it a staple for those seeking to fine-tune their entries and exits.
Pros:
- Strong community support
- Effective for spotting divergences
- Works well with EMAs
Cons:
- Can generate false signals in choppy conditions if used alone
Example: Many traders combine this tradingview indicator with moving averages for robust confirmation, improving overall trade accuracy. Its community backing ensures ongoing improvements and strategic insights.
Ichimoku Cloud
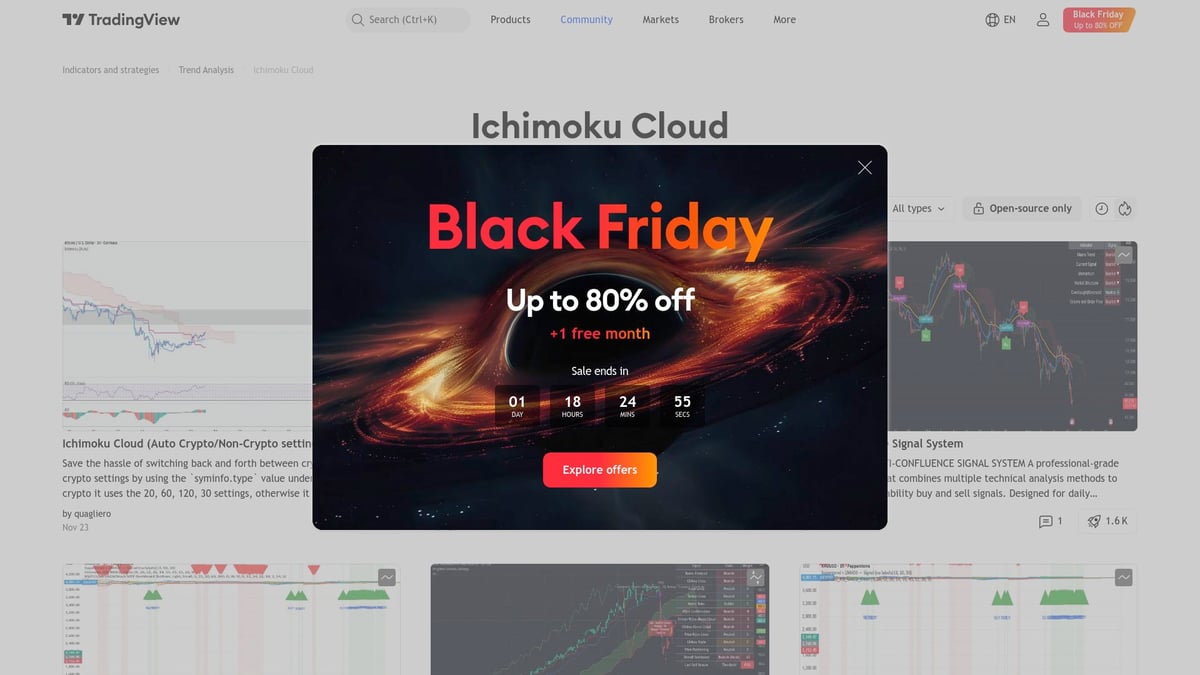
The Ichimoku Cloud remains a comprehensive tradingview indicator, offering a multi-layered approach to trend, momentum, and support/resistance analysis. Its five components deliver a complete market perspective at a glance.
Core features:
- Trend direction and reversal signals
- Dynamic support and resistance zones
- Momentum measurement
Benefits: Swing traders and trend followers favor this tool for identifying breakouts and continuations in volatile markets. Its visual clarity aids quick decision-making.
Pros:
- All-in-one analysis tool
- Adaptable to multiple timeframes
- Built-in on TradingView
Cons:
- Steep learning curve for beginners
Example: Traders often use this tradingview indicator to confirm significant price moves in forex and stocks, relying on its layered signals for confidence. Its enduring popularity is a testament to its analytical power.
Supertrend Indicator
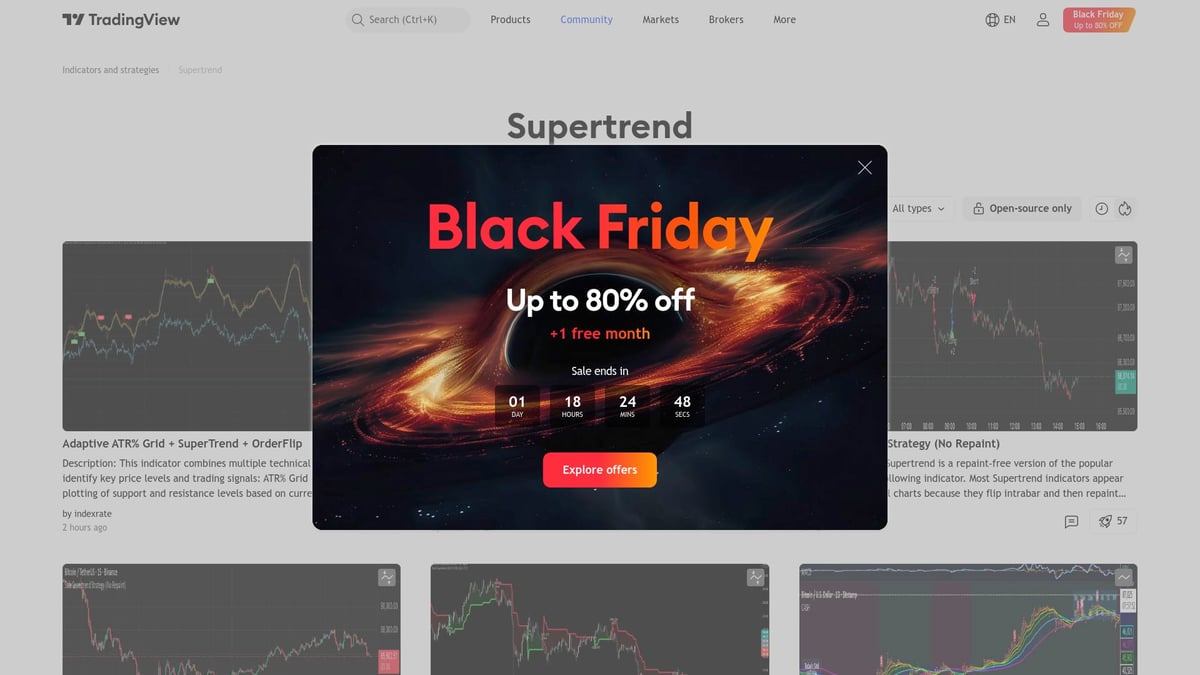
The Supertrend Indicator is a widely used, free tradingview indicator that plots dynamic buy and sell signals directly on the chart. It simplifies trend-following strategies with clear, color-coded cues.
Key features:
- Trend-based signal plotting
- Adjustable parameters for sensitivity
- Seamless integration with other indicators
Benefits: Day traders and swing traders love its simplicity and rapid response to price changes. It is particularly effective in markets with strong directional moves.
Pros:
- Minimal lag
- Easy to interpret
- Customizable for different assets
Cons:
- Prone to whipsaws in sideways markets
Example: Combining this tradingview indicator with ATR helps filter out false signals. Its popularity has soared due to its effectiveness and straightforward design.
MACD (Moving Average Convergence Divergence)
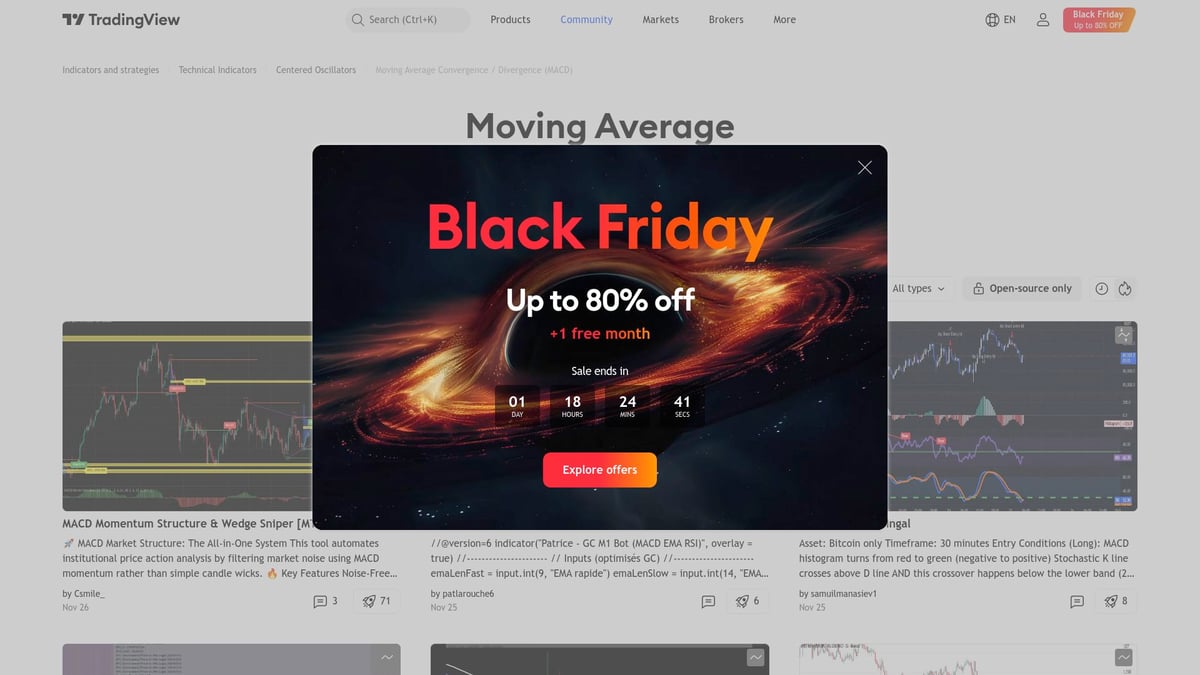
The MACD is a foundational tradingview indicator, blending trend and momentum analysis through EMAs and a signal line. Its histogram provides clear visual cues about market momentum.
Features:
- Identifies bullish and bearish momentum
- Highlights potential reversals
- Works across all asset classes
Benefits: Suitable for all types of traders, the MACD is often used for confirming trend strength and timing entries or exits.
Pros:
- Intuitive visual representation
- Adaptable settings
- Built-in to TradingView
Cons:
- Can lag in highly volatile markets
- Best paired with other indicators
Example: Traders frequently use this tradingview indicator to validate signals in stocks and crypto. For a deeper dive into its mechanics and strategy integration, see MACD Indicator Explained. Its timeless utility ensures relevance in 2026.
Bollinger Bands
Bollinger Bands are a classic tradingview indicator measuring price volatility using a moving average and dynamic bands. This setup helps traders identify overbought and oversold conditions, as well as potential breakout scenarios.
Core features:
- Volatility measurement
- Squeeze detection for breakout setups
- Visual cues for mean reversion
Benefits: Bollinger Bands are favored by traders looking for volatility expansion or contraction opportunities. Their adaptability makes them suitable for both trending and ranging markets.
Pros:
- Easy to understand
- Useful for breakout and reversal strategies
- Works on all timeframes
Cons:
- May produce false signals in strong trends
Example: This tradingview indicator is often used to spot “squeeze” conditions before sharp price moves, making it invaluable for timing entries.
Relative Strength Index (RSI)
The Relative Strength Index (RSI) is a momentum-based tradingview indicator that measures the speed and change of price movements. It is renowned for its simplicity and effectiveness across asset classes.
Key features:
- Overbought and oversold detection
- Divergence identification
- Trend strength measurement
Benefits: Traders use RSI to time entries and exits, especially during trend exhaustion phases.
Pros:
- Simple to set up and interpret
- Effective on all timeframes
- Reliable for divergence spotting
Cons:
- May remain overbought or oversold during strong trends
Example: When paired with moving averages, this tradingview indicator offers reliable confirmation for forex and equity trades. Its widespread use attests to its ongoing value for new and seasoned traders.
Squeeze Momentum Indicator
The Squeeze Momentum Indicator is a free tradingview indicator that merges Bollinger Bands and Keltner Channels to spot periods of low volatility, known as “squeezes.” These periods often precede explosive price moves.
Features:
- Highlights volatility contractions
- Alerts for potential breakout moves
- Customizable for different assets
Benefits: Swing traders and breakout specialists rely on this indicator to anticipate major market moves, particularly before earnings or news events.
Pros:
- Clear, actionable signals
- Works across asset classes
- Easy customization
Cons:
- May need parameter tuning for specific markets
Example: This tradingview indicator, when combined with volume analysis, can significantly improve the timing of entries during market breakouts.
Aroon Indicator
The Aroon Indicator is a built-in tradingview indicator designed to measure trend strength and detect potential reversals based on recent highs and lows. It is particularly useful for distinguishing between trending and ranging markets.
Core features:
- Trend identification
- Reversal signal detection
- Customizable lookback period
Benefits: Traders use the Aroon to avoid false breakouts and to confirm the direction of a developing trend.
Pros:
- Straightforward interpretation
- Effective trend filter
- Suitable for multiple asset classes
Cons:
- Less effective in low-volatility, choppy markets
Example: This tradingview indicator is commonly used to confirm trend changes in forex and index markets, helping traders filter out noise during uncertain periods.
Volume Profile Visible Range (VPVR)
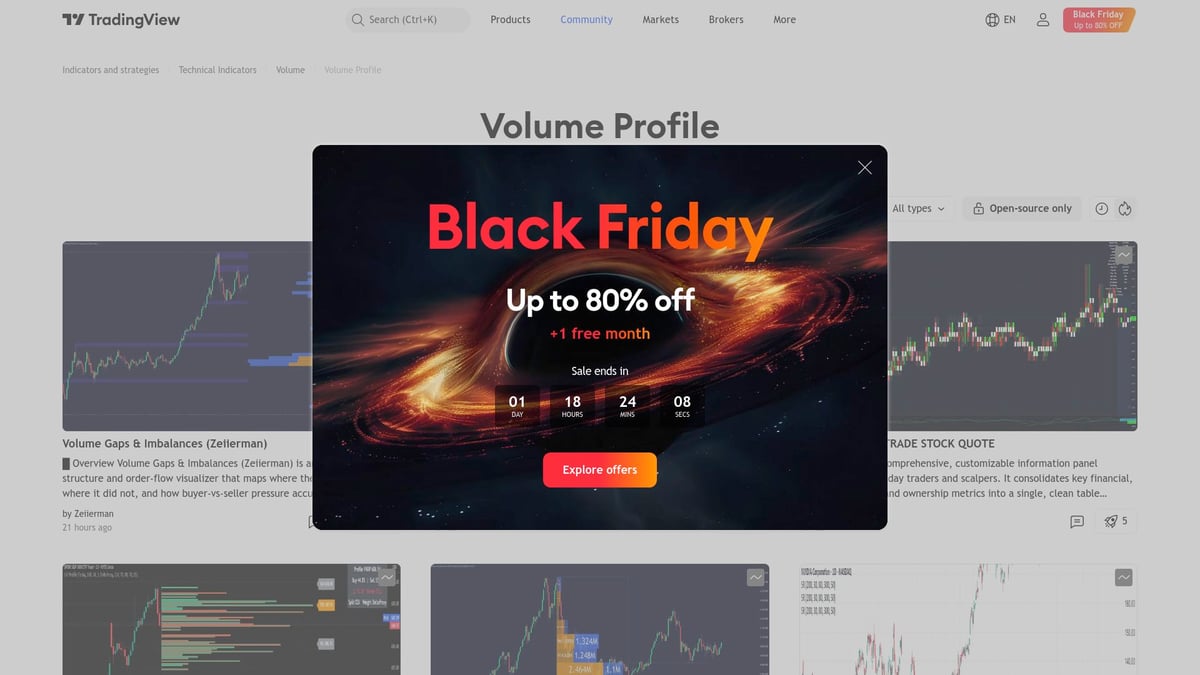
The Volume Profile Visible Range (VPVR) is a premium tradingview indicator that visualizes traded volume at different price levels. This helps traders identify key support and resistance zones based on actual market participation.
Key features:
- Volume-by-price distribution
- Identification of liquidity pools
- Highlights price acceptance and rejection areas
Benefits: Advanced traders, scalpers, and those analyzing institutional activity gain valuable insights into market structure using this tool.
Pros:
- Deepens price action analysis
- Pinpoints high-probability entry and exit zones
- Essential for volume-based strategies
Cons:
- Requires a TradingView Pro+ subscription
- May appear complex for beginners
Example: This tradingview indicator is instrumental in identifying potential reversal zones in crypto and futures markets, offering a significant edge for volume-focused traders.
Summary Table: Top 10 TradingView Indicators for 2026
| Indicator | Best For | Unique Strength | Pricing |
|---|---|---|---|
| PipTrend AI | All traders | adaptive signals | Paid |
| WaveTrend WT | Crypto, Forex | Early reversals | Free |
| Ichimoku Cloud | Swing, Trend | All-in-one analysis | Free/Built-in |
| Supertrend | Day, Swing | Simple trend signals | Free |
| MACD | All assets | Trend + momentum | Free/Built-in |
| Bollinger Bands | All assets | Volatility detection | Free/Built-in |
| RSI | All assets | Momentum, divergence | Free/Built-in |
| Squeeze Momentum | Swing, Breakout | Volatility squeezes | Free |
| Aroon | Trend ID, Filter | Trend strength | Free/Built-in |
| VPVR | Volume traders | Volume profile | Premium |
Each tradingview indicator in this list was selected for its ability to adapt to the evolving market landscape of 2026. By integrating these tools into your workflow, you are better positioned to spot opportunities and manage risk effectively.
Customizing and Combining Indicators for Maximum Edge
Customizing your tradingview indicator approach is essential for transforming raw data into actionable insights. Every trader faces unique challenges, so tailoring indicator settings and combinations to fit your strategy can make the difference between confusion and clarity.
Customizing Your TradingView Indicator Toolkit
A successful tradingview indicator setup begins with thoughtful customization. Adjust indicator parameters, such as lookback periods or thresholds, to fit the asset, timeframe, and volatility you trade. For instance, a 14-period RSI might work for daily charts, while a shorter period could suit scalping.
TradingView’s Pine Script empowers traders to build unique indicators or tweak existing ones. This flexibility enables you to align signals with your strategy and adapt quickly to evolving markets. Resources like Custom Settings for TradingView Indicators in 2025 offer practical guidance on optimizing settings for better performance.
Backtesting is crucial. By testing your tradingview indicator setup on historical data, you can evaluate signal reliability before risking real capital. Forward-testing in a demo environment further refines your approach, ensuring your customizations hold up under live conditions.
Combining Indicators for Smarter Signal Generation
No single tradingview indicator provides all the answers. Combining trend, momentum, and volume tools filters out noise and sharpens your edge. For example, pairing a Supertrend with RSI can clarify trend direction while highlighting overbought or oversold conditions.
Consider this simple combination table:
| Trend Indicator | Momentum Indicator | Volume Indicator |
|---|---|---|
| Supertrend | RSI | Volume Profile |
| Ichimoku Cloud | MACD | OBV |
| EMA | WaveTrend | VPVR |
Blending complementary indicators reduces false signals and increases confidence in your trades. For more advanced strategies, explore Trading Indicator Strategies, which details proven ways to merge signals for maximum accuracy.
Practical Examples and Best Practices
Let’s look at practical combos. A tradingview indicator blend like MACD with Bollinger Bands helps spot momentum shifts and volatility squeezes. Supertrend plus RSI is popular for timing entries in trending markets, while Ichimoku Cloud and ATR can catch strong breakouts.
Avoid indicator overload. Too many signals can cause analysis paralysis and missed opportunities. Focus on mastering a small, high-quality toolkit that aligns with your style.
Follow this expert advice: “Less is more, concentrate on a few indicators, but know them inside out.” Engage with the TradingView community to share scripts, backtest ideas, and stay updated on new developments.
Trading Smarter: Tips for Leveraging TradingView Indicators in 2026
Navigating the fast-changing world of trading requires more than just the right tools. As both TradingView and the broader markets evolve, traders must stay adaptable and consistently update their approach. The tradingview indicator landscape is shifting rapidly, making ongoing education and skill development essential for staying ahead.
The Evolution of the TradingView Indicator
Artificial intelligence and automation are transforming how traders use indicators. With smarter algorithms, signals can now adapt in real-time to shifting market conditions. Staying informed about these advancements is crucial for maximizing your edge. For a deeper dive into AI’s growing role, see TradingView’s AI Revolution in 2025. By leveraging these innovations, you can make more informed decisions and respond faster to market changes.
Practical Strategies for Indicator Integration
To get the most from any tradingview indicator, focus on practical integration within your trading plan. Use customizable alerts to avoid missing key setups, and apply multi-timeframe analysis to confirm signals. Always pair momentum tools with trend or volume indicators for higher accuracy. For example, the RSI Indicator for TradingView works well when combined with moving averages or Supertrend for better entries and exits. Remember to backtest your strategies before committing real capital.
Emotional Discipline and Risk Management
No tradingview indicator can guarantee profits, so emotional discipline remains essential. Set clear stop-losses and position sizes to manage risk, especially during volatile periods. Avoid chasing signals or overtrading based solely on indicators. Keep your setup simple and focus on mastering a few high-quality tools rather than overwhelming yourself with too many signals. This measured approach helps reduce stress and improves long-term consistency.
Community Collaboration and Continuous Improvement
The TradingView community offers a wealth of insights, custom scripts, and real-world feedback. Participate in forums, share your ideas, and learn from top-rated scripts to refine your tradingview indicator toolkit. Before using community-developed indicators, review user ratings and comments to ensure reliability. Commit to ongoing learning and experimentation, and regularly test new strategies in demo environments. By doing so, you’ll stay ahead of trends and make smarter, more confident decisions in 2026.
After exploring the top TradingView indicators for smarter trading in 2026, you can see just how powerful the right tools can be for your results. Whether you’re looking to simplify your strategy, gain more confidence in your trades, or take advantage of real time signals, the right indicator makes all the difference. PipTrend brings adaptive clarity and actionable alerts directly to your charts, helping you move from uncertainty to decisive trading, no matter your market or experience level. If you’re ready to see real improvement in your trading decisions, See Your Trading Improve With PipTrend.
Sources
Risk Disclaimer: Trading involves risk. Past performance doesn't guarantee future results. Only trade with money you can afford to lose. PipTrend is a tool to assist your trading decisions, not financial advice.