Best Propfirms: How to Choose and Pass in 2026

On this page
You passed the prop firm challenge once. Then you blew the funded account three weeks later. The problem wasn’t your strategy. It was your inability to separate trend direction from entry timing, and your prop firm’s tight 4% daily drawdown didn’t care about your intentions. The best propfirms in 2026 aren’t the ones with the flashiest marketing or the loosest rules. They’re the firms that match your trading style, your timeframe preferences, and your ability to execute a repeatable process under pressure. This matters because choosing the wrong firm costs you evaluation fees, time, and confidence. Choosing the right one gives you capital, structure, and proof that your edge works at scale.
Understanding Modern Prop Firm Models
The prop firm industry split into two distinct paths in the last 24 months. Traditional proprietary trading firms like Jump Trading and Headlands Technologies hire full-time traders, provide salary plus profit splits, and operate with institutional capital. You won’t get into these firms without quantitative skills, computer science degrees, or market-making experience. That’s not what most intermediate traders need.
Retail-focused prop firms operate differently. You pay an evaluation fee, pass a challenge with specific profit targets and drawdown limits, then receive a funded account. Your profit split ranges from 70% to 90% depending on the firm and account size. The challenge structure determines your success rate more than your raw trading ability.
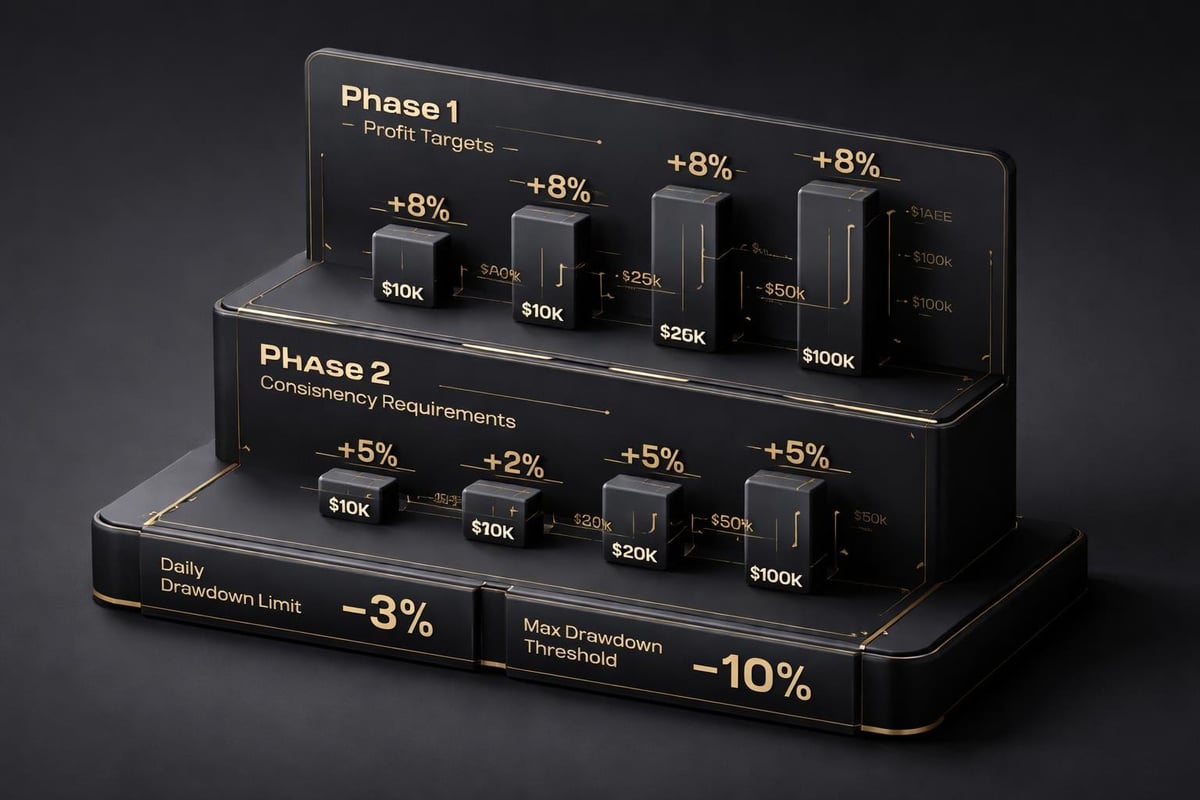
Most firms use a two-phase model. Phase 1 requires you to hit a profit target (usually 8-10%) without exceeding maximum drawdown (typically 10%) or daily drawdown (usually 4-5%). Phase 2 verifies consistency with a lower profit target (4-5%) and the same risk limits. You must follow specific rules about holding trades through news events, weekend positions, and minimum trading days.
The daily drawdown rule kills more challenge attempts than anything else. You can’t lose more than 4-5% of your starting balance in a single day. If your account starts at $100,000 and your daily limit is $5,000, hitting $95,000 at any point during the trading day fails you instantly. This applies to closed losses and open floating losses combined.
Key Metrics That Separate Winners from Losers
Your win rate doesn’t matter as much as your average risk-to-reward ratio and your largest losing day. A trader with a 45% win rate and 1:3 RR ratio passes challenges more consistently than a trader with 65% win rate and 1:1 RR ratio. The math favors controlled losses and larger wins.
Track these numbers for your last 50 trades before attempting any challenge. Your largest single loss as a percentage of account balance tells you if you can survive the daily drawdown limit. If your worst loss in the last 50 trades was 2.8% and the firm’s daily limit is 4%, you have room for error. If your worst loss was 6%, you’ll fail eventually.
Your average holding time determines which evaluation period suits you. Day traders using 5m and 15m charts need firms that allow high-frequency trading without minimum holding time requirements. Swing traders using H4 and Daily charts need firms that permit weekend holds and don’t force minimum trading days within tight windows.
Evaluating the Best Propfirms for Your Strategy
Recent comprehensive rankings assess prop firms on solvency, drawdown structures, platform options, and actual payout speeds. The best propfirms for you depend on three factors: your trading timeframe, your typical trade duration, and your maximum tolerable drawdown per position.
If you trade Forex pairs on 1m to 15m timeframes with 10-30 pip targets, you need tight spreads, fast execution, and no restrictions on scalping. Firms that add commission structures or require minimum 3-minute hold times will destroy your edge. You’re hunting 2-5 trades per session with 1:2 minimum RR ratios.
If you trade H1 to H4 timeframes with 80-150 pip targets on EUR/USD, GBP/USD, or major indices, you need firms that allow news trading and overnight positions. Your edge comes from direction accuracy, not entry precision. You’re taking 3-8 trades per week with 1:3 RR ratios and holding through minor pullbacks.
Comparing Challenge Rules Across Top Firms
Different firms apply vastly different interpretations of the same rule. “Maximum drawdown” sounds simple until you realize some firms calculate it from starting balance while others calculate it from highest achieved balance. This changes everything about position sizing.
Static drawdown calculates from your starting balance. You start with $100,000 and 10% max drawdown means you fail at $90,000 no matter what happens. If you grow the account to $108,000 and then drop to $91,000, you’re still safe. This model rewards aggressive compounding once you build a cushion.
Trailing drawdown follows your high water mark. You start with $100,000 and 10% trailing drawdown. You grow to $108,000. Now your failure point moves to $97,200. This model punishes giving back profits and forces tighter risk management as you grow the account.
| Drawdown Type | Starting Balance | After +8% Growth | Failure Point | Risk Impact |
|---|---|---|---|---|
| Static | $100,000 | $108,000 | $90,000 | Allows aggressive scaling |
| Trailing | $100,000 | $108,000 | $97,200 | Requires tighter management |
| Daily Limit | $100,000 | $108,000 | -$5,000/day | Caps per-session risk |
Your strategy’s maximum adverse excursion determines which model you can survive. If your winning trades typically go 40 pips against you before moving 120 pips in your favor, you need room for that heat. Calculate your typical MAE as account percentage, add 1% buffer, and make sure it fits under the daily limit.
Building a Challenge-Passing System
You can’t trade the same way in a prop firm challenge that you trade in your personal account. The asymmetric risk structure requires modifications. Your personal account tolerates 7% losing days because you control the capital and the timeline. The challenge fails you permanently at 5% daily loss.
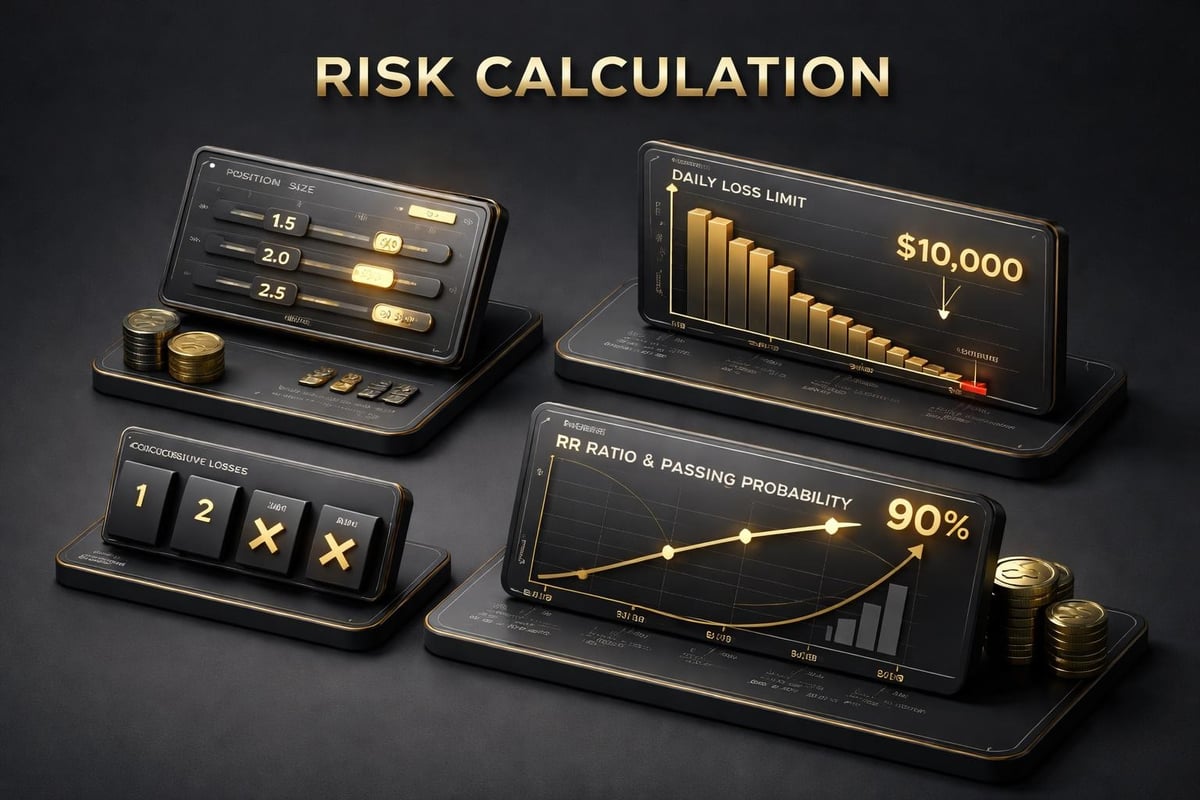
Start by reducing your standard position size by 40-60% for challenge attempts. If you normally risk 1.5% per trade, drop to 0.6-0.9% during evaluations. This sounds overly cautious until you calculate the scenarios. At 0.8% risk per trade, you need six consecutive losses to approach a 5% daily limit. At 1.5% risk, three bad trades in one session ends your attempt.
Your entry precision matters more in challenges than in personal trading. Direction and entry are separate decisions. Knowing EUR/USD will move up 100 pips today doesn’t tell you whether to enter now or wait for a 30-pip pullback to VWAP. Entering 20 pips early on a 1:3 trade means your stop hits before the move develops.
Multi-Timeframe Confirmation Reduces Challenge Failures
The traders who pass challenges consistently aren’t the ones with the highest win rates. They’re the ones who wait for alignment across timeframes before entering. You spot a bullish setup on H1. You check H4 for trend direction. You check Daily for major support/resistance zones. You check 15m for entry timing. All four need to agree.
This is where most challenge attempts fail. You see a setup on your preferred timeframe and take it immediately because you’re trying to hit profit targets quickly. The trade goes against you because the Daily chart showed you’re selling into major support, or the 15m chart showed you entered during a counter-trend bounce.
Build a confirmation checklist that requires three specific conditions before entry. First condition: trend direction on your analysis timeframe (H1, H4, or Daily depending on your style). Second condition: clear entry signal on your execution timeframe (5m, 15m, or H1). Third condition: no conflicting signals from the timeframe above your analysis level.
For a long trade on EUR/USD using H1 analysis and 15m entries, you need bullish trend on H1, bullish entry signal on 15m, and no bearish pattern or major resistance on H4. This filters out 60-70% of marginal setups that create unnecessary drawdown. You take fewer trades, but each trade has higher probability and better RR potential.
Technical Execution for Funded Account Trading
The best propfirms provide MT4, MT5, cTrader, or TradingView integration. Your platform choice impacts execution speed, charting capability, and indicator availability. MT4 works for basic price action traders. MT5 handles multiple asset classes better. TradingView offers superior charting but sometimes slower execution.
You need non-repainting signals that confirm after candle close. Indicators that recalculate historical values make backtesting worthless and forward testing unreliable. You think you had a signal at 1.0850, but the indicator repaints and now shows the signal was actually at 1.0830. You can’t build a repeatable process on shifting information.
Session liquidity levels give you concrete entry points instead of vague zones. VWAP, previous day high/low, session open levels, and major supply/demand zones don’t move. You know exactly where institutional orders sit. You wait for price to reach those levels, confirm direction with your system, then enter with tight stops below/above the liquidity point.
Many traders use established prop firms but fail because they don’t adapt their process to funded account requirements. They trade the same random entries that worked in personal accounts where patience and position size flexibility compensated for poor timing. Challenges don’t give you that room.
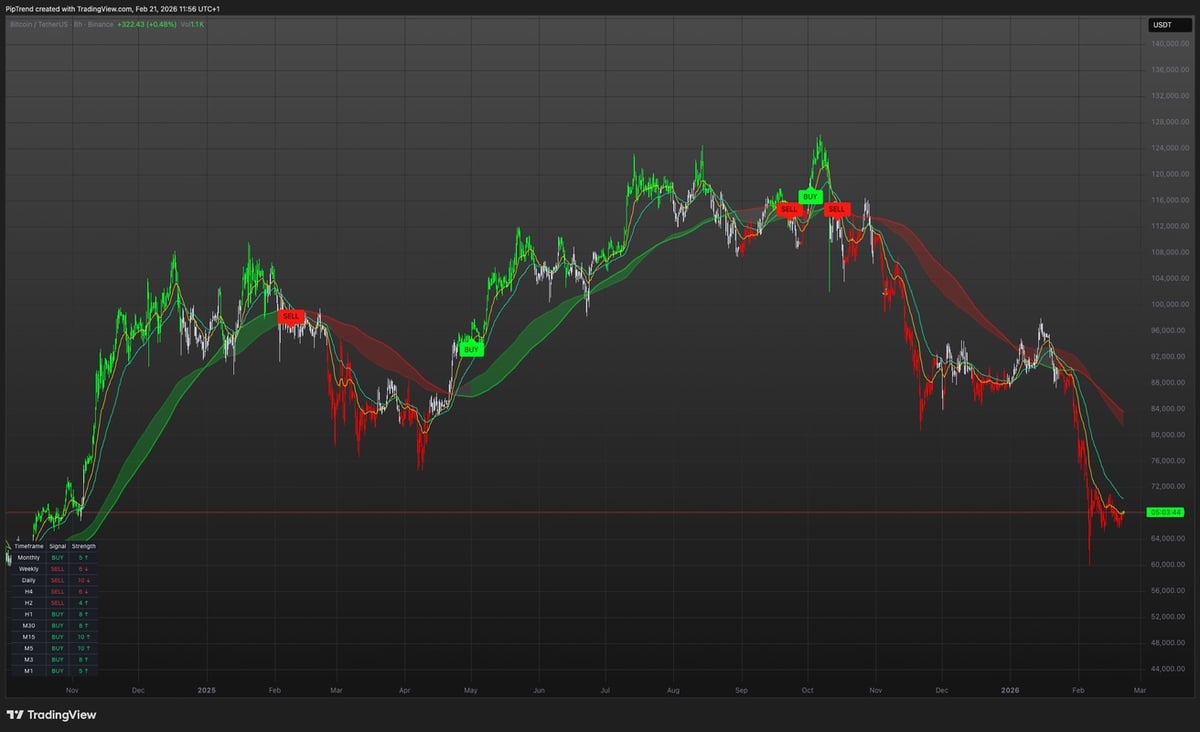
PipTrend solves this exact problem by giving you three distinct pieces of information in one unified system. Core/V2 shows trend direction through non-repainting BUY/SELL signals that confirm after candle close. Session Liquidity marks precise entry levels at institutional zones like VWAP and HOD/LOD. The Multi-Timeframe Table displays 12 timeframes simultaneously so you verify alignment before risking capital. This separation of direction, entry, and management removes the guesswork that kills challenge attempts.
Managing Open Trades During Drawdown Limits
Your trade management protocol determines whether you pass or fail when trades move against you. You enter EUR/USD long at 1.0850 targeting 1.0920 with stop at 1.0820. The trade drops to 1.0835 in the first hour. You’re down 15 pips on a position sized at $10 per pip. That’s $150 floating loss on a $100,000 account.
Now you have a decision. The H4 chart still shows bullish structure. The Daily trend hasn’t broken. But your challenge account is down 0.15% on one trade, and you planned to take two more setups today. If both go against you similarly, you’re down 0.45% before any trade hits target or stop.
Set a maximum open drawdown limit separate from your per-trade risk. You risk 0.8% per trade (stop loss), but you also set a rule that if total open floating loss across all positions exceeds 2% account value, you close the worst-performing trade immediately. This prevents the scenario where three trades all sit at -0.6% floating loss (1.8% total) and one more spike against you triggers daily limit violation.
Check your open positions at specific times rather than constantly. For day traders on 5m-15m charts, check every 30 minutes. For H1 traders, check every 2-4 hours. For H4+ traders, check twice per day maximum. Constant monitoring creates emotional decisions. You close winning trades too early and hold losing trades too long because you’re reacting to every 5-pip move.
Risk Management Numbers That Work
Your maximum daily loss should be 60-70% of the firm’s daily limit. If the firm allows 5% daily drawdown, your personal stop is 3%. If you hit 3% down in a day, you stop trading completely until the next session. This buffer protects against execution slippage, spread widening during news, or one final trade that seems perfect but adds another 0.8% loss.
Position sizing follows a fixed percentage model, not a fixed lot size. Trading 0.1 lots on every trade regardless of stop distance guarantees inconsistent risk. A 30-pip stop with 0.1 lots on EUR/USD risks $30 if you’re trading $1 per pip. A 60-pip stop with 0.1 lots risks $60. That’s double the risk for the same position size.
Calculate position size from account balance, risk percentage, and stop distance in pips. Formula: (Account × Risk%) ÷ Stop Distance in Pips. For $100,000 account, 0.8% risk, and 40-pip stop: ($100,000 × 0.008) ÷ 40 = $20 per pip. On EUR/USD with standard lots, that’s 2.0 lots. For a 25-pip stop on the same setup: ($100,000 × 0.008) ÷ 25 = $32 per pip, or 3.2 lots.
| Account Size | Risk % | Stop Distance | Position Size | Dollar Risk |
|---|---|---|---|---|
| $100,000 | 0.8% | 30 pips | $26.67/pip | $800 |
| $100,000 | 0.8% | 50 pips | $16.00/pip | $800 |
| $100,000 | 1.2% | 40 pips | $30.00/pip | $1,200 |
Never increase risk percentage during a challenge. You’re not trying to pass faster by taking bigger risks. You’re trying to demonstrate consistency and controlled risk management. Firms want traders who protect capital first and generate returns second. A 12% gain over 30 days with 2.1% max drawdown impresses them more than 18% gain with 7.8% drawdown.
Common Mistakes That Fail Funded Accounts
Trading through major news events without adjusting position size kills more funded accounts than bad technical analysis. You hold a short on GBP/USD into Bank of England rate decision because your H4 chart shows downtrend. The BOE surprises with hawkish commentary. Price spikes 120 pips in four minutes. Your 50-pip stop evaporates. You’re down 2.4% in one event.
Close all positions 15 minutes before high-impact news (NFP, FOMC, CPI, central bank rates) or reduce position size to 25% of normal. If you normally trade 2.0 lots, drop to 0.5 lots through news. Your profit potential decreases, but your challenge survival increases dramatically. Most top prop firms either prohibit news trading entirely or track whether blown accounts correlate with news events.
Revenge trading after a losing day destroys challenges within hours. You lose 1.8% on Tuesday. Wednesday morning you enter three trades in 90 minutes trying to recover that loss. All three are marginal setups you’d normally skip. Two hit stops. You’re down another 1.6%. Total two-day loss: 3.4%. One more bad trade triggers failure.
Implement a same-day loss limit and next-day trade limit. If you lose more than 1.5% in one day, you take maximum one trade the following day. That one trade must meet every condition on your checklist. No exceptions for “obvious” setups. This rule alone increases challenge passing rates by 30-40% because it prevents emotional spirals.
Selecting Firms Based on Asset Class and Style
Forex traders need tight spreads on major pairs and reasonable overnight swap rates. If you trade EUR/USD, GBP/USD, USD/JPY, your spread should be 0.0-0.3 pips on raw accounts or 0.6-1.0 pips on standard accounts. Anything wider erodes scalping edges and makes 1:2 RR targets harder to achieve. Check overnight swap costs if you hold positions through sessions. A $15 swap charge on a 2.0-lot position removes 15 pips of potential profit.
Crypto traders need firms that offer BTC/USD, ETH/USD, and major altcoins with 24/7 trading permission. Crypto volatility means wider stops and larger pip targets. A 40-pip stop on EUR/USD is tight. A 400-point stop on BTC/USD might represent the same 0.8% account risk. Verify the firm calculates risk percentage correctly across different asset denominations.
Indices traders focus on US30, NAS100, SPX500, and major international indices. Your typical trade holds 4-18 hours capturing directional moves of 80-250 points. You need firms allowing overnight holds and weekend positions. Some firms force-close all positions at Friday market close, destroying swing trading edges that capture Monday gap continuations.
Stock traders require access to specific tickers, pre-market and after-hours trading, and reasonable commission structures. Trading Apple, Tesla, or Microsoft with $8 commissions per round turn on 100 shares adds $0.08 per share in cost. That’s fine on a $15 price move but devastating on quick $2-3 scalps.
Timeframe-Specific Challenge Strategies
Trading 1m to 5m charts during challenges requires extreme discipline. You’re taking 5-15 trades per day with 5-15 pip targets and 8-12 pip stops. Your win rate needs to exceed 55% because your RR ratio rarely exceeds 1:1.5. One major mistake: taking signals that appear during the first 30 minutes after session open (London, New York). Spread widens, liquidity shifts, and false breakouts triple in frequency.
Wait 30-45 minutes after major session opens before entering trades on timeframes below 15m. Use that time to mark session high/low, identify VWAP level, and note any overnight gaps or weekend gaps that need filling. Your first trade should come from a clear rejection of a marked level, not a random candle pattern at 8:02 AM EST.
H1 to H4 traders take 2-6 trades per week with 60-120 pip targets and 35-50 pip stops. Your edge comes from catching multi-hour directional moves after pullbacks complete. The challenge here is patience. You see your profit target sitting at 4% after two weeks and you start forcing trades to reach 8% faster. Those forced trades create drawdown that eliminates your profit cushion.
Set weekly profit targets instead of obsessing over the final 8-10% number. Week one: 2%. Week two: 2.5%. Week three: 2%. Week four: 1.5%. This pacing keeps you selective and prevents the profit-chasing that leads to overtrading. You reach 8% in 28 days with controlled risk instead of attempting 8% in 12 days with dangerous position sizes.
Daily and Weekly chart traders take 1-4 trades per month with 200-500 pip targets and 80-150 pip stops. Your challenge is different. You need firms offering extended evaluation periods (60-90 days minimum) because your trading frequency doesn’t fit 30-day windows with minimum trading day requirements. Look specifically for firms that waive minimum trading days or extend deadlines for higher-timeframe traders.
The best propfirms in 2026 match your trading timeframe, respect your need for multi-asset access, and provide evaluation structures that test consistency rather than luck. You pass challenges by separating trend direction from entry timing, maintaining strict daily loss limits, and trading a repeatable process across every setup. PipTrend gives you that repeatable process through unified direction signals, institutional entry levels, and 12-timeframe confirmation in one system built specifically for traders who need consistency under prop firm pressure.
Risk Disclaimer: Trading involves risk. Past performance doesn't guarantee future results. Only trade with money you can afford to lose. PipTrend is a tool to assist your trading decisions, not financial advice.